Abstract
This study was aimed to investigate the changes of brain MRI features and serum biological parameters in patients with TLE. 30 patients with unilateral TLE confirmed by surgical pathology were selected as study subjects, and 30 subjects without a history of epilepsy who underwent health examinations during the same period were selected as controls. The brain MRI features of the patients were explored and the T2 relaxation time (HCT2) indexes of the bilateral hippocampus were extracted. The differences in levels of peripheral blood T lymphocyte subsets, inflammatory cytokines, and miRNAs were measured. The results showed that the hippocampal volume of TLE patients was significantly reduced, and the HCT2 value of the hippocampus was greater than that of the control group (). CD3+ (77.9 ± 4.4)%, CD4+ (45.6 ± 2.2)%, CD8+ (22.1 ± 1.9)%, and CD3+/CD8+ (2.24 ± 0.22) in peripheral blood T lymphocyte subsets of epileptic patients, compared with control group, CD3+, CD4+, and CD4+/CD8+ levels were significantly increased and CD8+ concentration was significantly decreased in epileptic patients (); inflammatory cytokines TNF-α was (2.63 ± 0.26) pg/mL, IL-1β was (4.61 ± 0.57) pg/mL, IL-2 was (1.59 ± 0.21) pg/mL, IL-6 was (2.28 ± 0.19) pg/mL, and ICAM-1 was (1.89 ± 0.30) pg/mL in peripheral blood of epileptic patients, which was significantly increased compared with control group, while IL-10 was significantly decreased in epileptic patients (); miR-146a was (2.14 ± 0.28) and miR-210 was (1.89 ± 0.31), miR-221 (2.44 ± 0.35), miR-34a (0.59 ± 0.14), miR-135b (10.17 ± 0.16), miR-33 (0.26 ± 0.09) in peripheral blood miRNA levels of epileptic patients, and miR-146a, miR-210, miR-221, and miR-34a levels of epileptic patients were significantly increased compared with control group, while MiR-135b and miR-33 levels of epileptic patients were significantly reduced (). In summary, patients with TLE have hippocampal lesions, which may be related to peripheral blood T lymphocyte subsets imbalance, chronic inflammatory response, and abnormal expression of miRNAs.
1. Introduction
There are many factors that induce epilepsy, which are mainly characterized by transient central nervous cell dysfunction due to recurrent episodes of abnormal neuronal discharges, so it belongs to chronic neurological diseases [1]. The medial temporal lobe structures of the brain are mainly composed of hippocampal regions, amygdala regions, and internal olfactory cortex. When these structures are abnormal, it will lead to the occurrence of TLE [2]. Studies have confirmed that hippocampal sclerosis is one of the main factors leading to TLE [3]. Epilepsy patients will be accompanied by different degrees of psychological and behavioral disorders, which has seriously affected the quality of life of patients. Therefore, how to effectively control seizures has become the focus of current research. The pathogenesis of epilepsy is complex and not fully elucidated. However, the evidence shows that immune factors play an important role in seizures [4, 5]. CD4+ and CD8+ in T lymphocyte subsets have been confirmed to be related to the degree of neuronal injury in the hippocampus, which in turn is involved in the process of TLE [6]. In addition, neuronal apoptosis and abnormal inflammatory response are also important pathological links causing seizures. The overexpression of promoting apoptotic factors, the excessive accumulation of inflammatory factors, and abnormal neuronal function are all related to the occurrence and development of epilepsy [7]. MiRNAs, as a class of non-coding RNA molecules about 20∼24 bp in length, are involved in the regulation of a variety of gene expression and signaling pathways in the body. At present, it has also been confirmed that miRNAs are involved in the regulation of the function of the nervous system, including the development of nerve cells, neuronal apoptosis, and the differentiation of neural stem cells [8].
Drugs are the treatment of choice for epilepsy, appropriate and standardized antiepileptic drugs are used for the treatment of patients with primary epilepsy, but about 30% of patients are still difficult to control the condition. Medical refractory epilepsy can be treated with surgical resection of the lesion, and 70% of patients with refractory epilepsy are effectively controlled for seizures after surgical treatment [9]. For this reason, preoperative identification of the lesion is important for the success rate of surgery. The clinical methods used for the diagnosis of epilepsy include clinical features, EEG detection, and imaging examination. EEG is effective for the qualitative diagnosis of TLE, but it is not able to localize epileptic foci [10]. Medical imaging enables the assessment of pathological changes through quantitative changes in texture characteristics. MRI is one of the main modalities used for the evaluation of hippocampal lesions in preoperative TLE. The main MRI features of TLE patients are atrophy of hippocampal volume and enhancement of T2WI signal, so it can be used for quantitative evaluation of hippocampal lesions [11].
There are relatively few studies on the measurement of hippocampal T2 relaxation time (HCT2), an MRI characteristic indicator of TLE, as well as the analysis of serum biological parameters. Therefore, patients with unilateral TLE were selected as the study subjects, and the characteristics of brain lesions were evaluated using MRI techniques, followed by the changes in the expression levels of peripheral blood T lymphocyte subsets, inflammatory cytokines, and miRNAs, providing a reference for early diagnosis and treatment of TLE.
2. Materials and Methods
2.1. Subjects
Thirty patients with unilateral TLE confirmed by surgical pathology from June 2020 to March 2022 were selected as study subjects. 30 subjects without a history of seizures who underwent health examinations during the same period were selected as controls. This study had been approved by the ethics committee of the hospital and the patient signed the informed consent form.
Inclusion criteria: (1) according to the guidelines for epilepsy prevention and treatment issued by the International League Against Epilepsy in 2017 [12], combined with clinical features, EEG, and auxiliary examination methods, patients were diagnosed with unilateral TLE; (2) preoperative conventional MRI examination, scanning sequence including T2-FLAIR, and image texture without artifacts; (3) no family history of seizures; (4) no recent immunosuppressive agents, hormones, and other drug treatment. Exclusion criteria: (1) combined with brain diseases, such as intraluminal tumors, traumatic brain injury, stroke, hysteria, and other diseases; (2) secondary TLE caused by central nervous system infection; (3) combined with systemic lupus erythematosus and other autoimmune diseases; (4) incomplete clinical data.
2.2. Imaging Examination
3.0T MRI instrument was selected for conventional MRI scanning. The scanning sequences included: (1) axial T1-FLAIR, T2WI, T2-FLAIR; (2) sagittal T2WI; (3) dual-echo oblique coronal plane of SE sequence with the vertical long axis of the hippocampus. The region of interest was selected as far as possible to avoid the influence of cerebrospinal fluid and skull base structures. FLAIR scan parameters were set: (1) repetition time 8,800 ms; (2) recovery time 95 ms; (3) slice thickness 3 mm; (4) interslice distance 0 mm; (5) matrix 512°×°512. SE scan parameters were set: (1) repetition time 3,000 ms; (2) recovery time 20 ms; (3) slice thickness 4 mm; (4) interslice distance 0 mm; (5) matrix 512°×°512. T2 relaxation diagram was calculated for each slice using T2 relaxation diagram, and hippocampal HCT2 were measured. The measured area did not encase the border of the hippocampal region, cystic areas, and cerebrospinal fluid in a hippocampal fissure.
2.3. Detection of Peripheral Blood T Lymphocyte Subsets
In 5°mL of fasting venous blood was collected and anticoagulated with ethylenediaminetetraacetic acid, and TLE patients were seizure free for 72 hours before blood collection. Patients with TLE had no seizures within 72 hours before blood sampling. Fluorescence staining agent was added to label CD3, CD4, and CD8 molecules on the lymphocyte surface; 100 μL anticoagulation was added and mixed well; it was incubated in the dark at room temperature for 15 min. 2 mL FACSLysing solution was added; it was incubated in the dark at room temperature for 10 min; it was centrifuged at 300 rpm for 5 min. After discarding the supernatant, the cells were washed with phosphate buffer, and CD3+, CD4+, CD8+, and CD4+/CD8+ of peripheral blood T lymphocyte subsets were detected using a flow cytometer.
2.4. Detection of Inflammatory Cytokines in Peripheral Blood
5°mL of fasting venous blood was collected from both groups of study subjects, and serum was separated and stored in a −80°C freezer. The serum levels of TNF-α, IL-1β, IL-2, IL-6, IL-10, and ICAM-1 were measured by an ELISA detection kit (Shanghai mlbio). The antibody coating of the microtiter plate was performed, the standards were diluted in turn and mixed with serum, and the reaction was performed at 37°C for 1.5 h after sealing; 100 μL of TNF-α, IL-1β, IL-2, IL-6, IL-10, and ICAM-1 antibody working solutions were added, respectively, and the reaction was performed at 37°C for 1 h after sealing; after washing the microtiter plate with buffer, 100 μL of diluted ABC working solution was added, and the reaction was performed at 37°C for 30 min after sealing; after washing the microtiter plate with buffer, 90 μL of TMB chromogenic solution was added, and the reaction was performed in the dark at 37°C for 20 min after sealing; 100 μL of stop solution was added, and the O.D. value of each well was measured using a microplate reader.
2.5. Detection of miRNAs in Peripheral Blood
An additional 5 mL of fasting venous blood was collected and serum was separated and stored in a −80°C freezer. Serum/plasma miRNA extraction and isolation kit was used for the extraction and reverse transcription of miRNAs in serum, and the cDNA obtained by reverse transcription was used as a template for subsequent PCR detection. Quantitative detection of miR-146a, miR-210, miR-221, miR-34a, miR-135b, and miR-33 were performed using the miRcute enhanced miRNA SYBR Green fluorescence quantitative detection kit.
2.6. Statistical Analysis
Statistical analysis of the experimental data was performed using SPSS 19.0 software. Enumeration data were expressed as frequency (percentage), and differences were compared using the chi-square test. Measurement data were expressed as mean ± SD, and differences were compared using an independent sample t-test. Differences were considered statistically significant at .
3. Results
3.1. Comparison of General Data
The differences in the basic data of patients in the epilepsy and control groups were compared. There was no significant difference in sex ratio, age, BMI, history of diabetes, and history of hypertension between the epilepsy and control groups () (Table 1).
3.2. Analysis of Brain MRI Characteristics
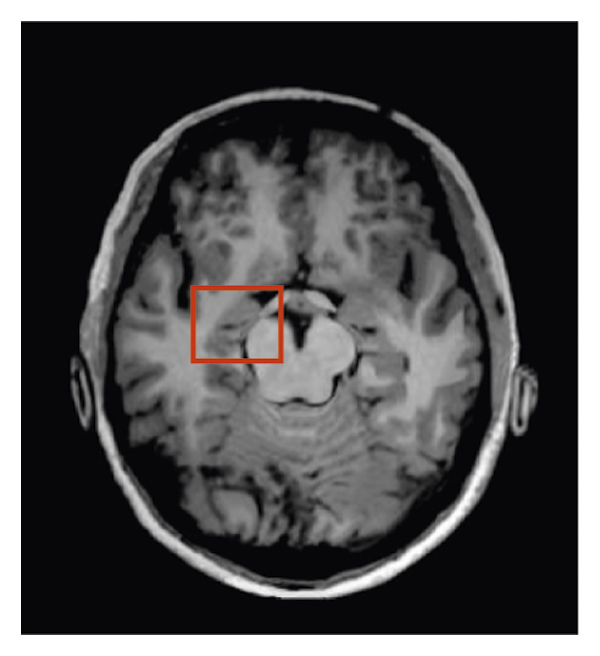
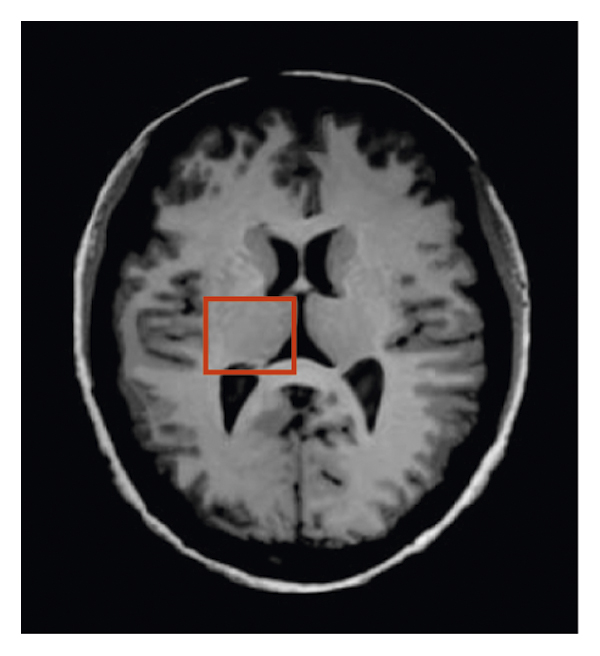
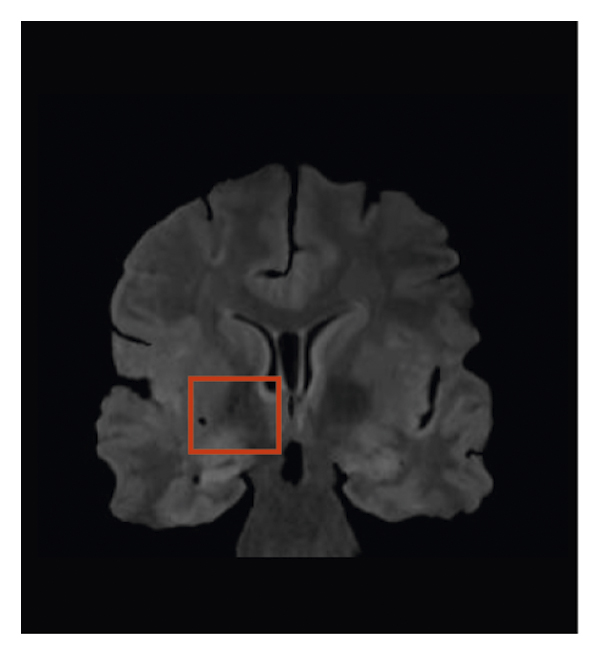
Brain MRI images of a 43-year-old male patient with TLE were analyzed. The patient’s right hippocampus was significantly reduced in size and increased in signal (Figure 1).
(a)
(b)
(c)
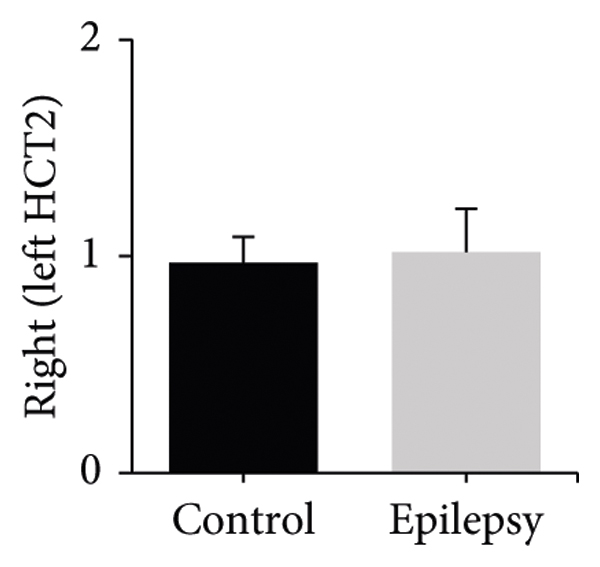
The difference between HCT2 values in the patient’s hippocampus was subsequently measured by SE sequence dual-echo oblique coronal plane (Figure 2). The right HCT2 values were (85.6 ± 2.4) ms and (92.3 ± 1.8) ms, the left HCT2 values were (86.1 ± 1.2) ms and (92.7 ± 2.0) ms, and the right/left HCT2 ratios were (0.97 ± 0.12) and (1.02 ± 0.20) in the control and epileptic groups, respectively. Compared with the control group, HCT2 values in the right and left hippocampus were significantly increased in the epileptic group (); however, there was no difference in the right/left HCT2 ratio ().

(a)

(b)
(c)
3.3. Changes of Peripheral Blood T Lymphocyte Subsets Levels
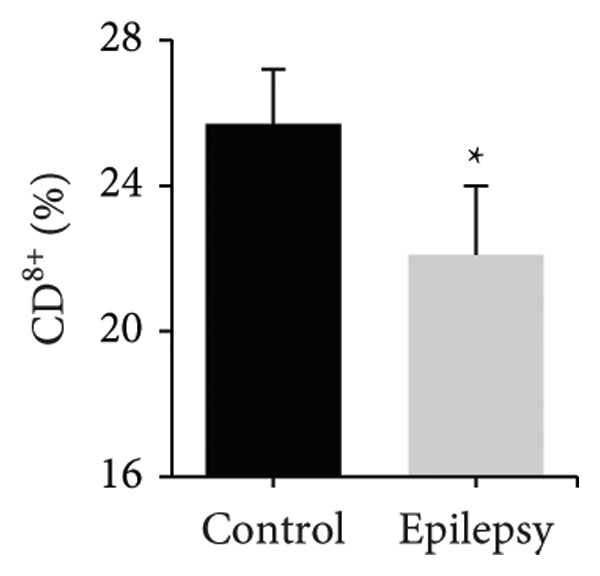
The differences in the levels of CD3+, CD4+, CD8+, and CD4+/CD8+ of peripheral blood T lymphocyte subsets between the two groups were compared (Figure 3). Peripheral blood CD3+ was (73.4 ± 3.1)% and (77.9 ± 4.4)%, CD4+ was (41.5 ± 2.7)% and (45.6 ± 2.2)%, CD8+ was (25.7 ± 1.5)% and (22.1 ± 1.9)%, and CD4+/CD8+ was (1.61 ± 0.10) and (2.24 ± 0.22) in the control and epileptic groups, respectively. Compared with the control group, the levels of CD3+, CD4+, and CD4+/CD8+ in the peripheral blood of patients in the epilepsy group were significantly increased, while the level of CD8+ in the epilepsy group was significantly decreased ().

(a)

(b)
(c)

(d)
3.4. Changes of Inflammatory Cytokine Levels in Peripheral Blood
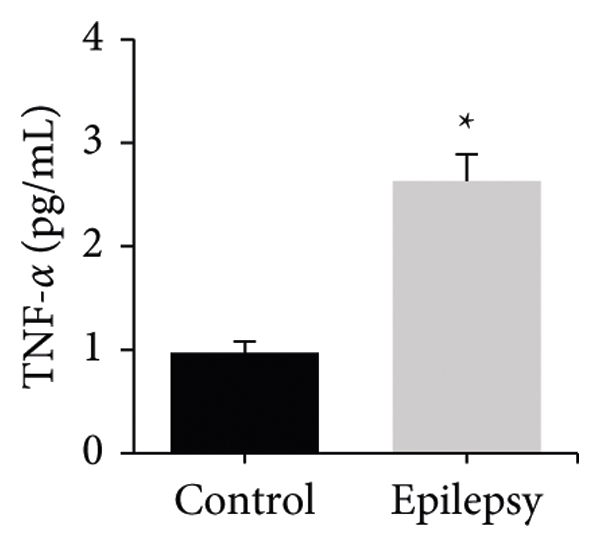
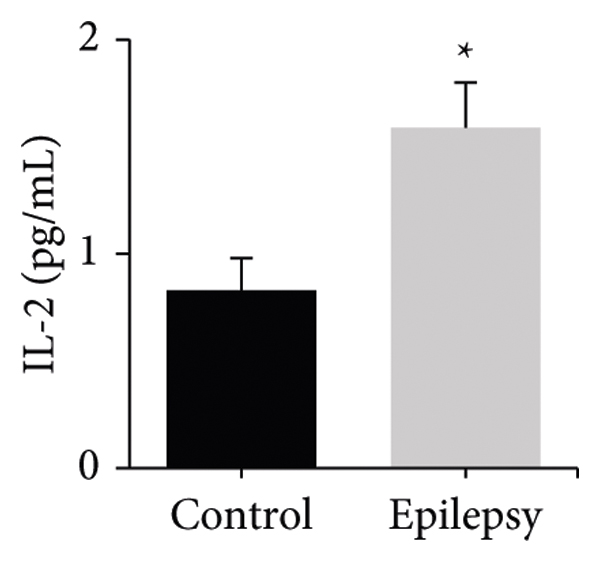
The differences in the levels of inflammatory cytokines TNF-α, IL-1β, IL-2, IL-6, IL-10, and ICAM-1 in peripheral blood between the two groups were compared. It can be observed that the peripheral blood TNF-α levels were (0.97 ± 0.11) pg/mL and (2.63 ± 0.26) pg/mL, IL-1β levels were (1.70 ± 0.33) pg/mL and (4.61 ± 0.57) pg/mL, IL-2 levels were (0.83 ± 0.15) pg/mL and (1.59 ± 0.21) pg/mL, IL-6 levels were (1.01 ± 0.14) pg/mL and (2.28 ± 0.19) pg/mL, IL-10 levels were (1.31 ± 0.14) pg/mL and (0.25 ± 0.09) pg/mL, and ICAM-1 levels were (1.03 ± 0.22) pg/mL and (1.89 ± 0.30) pg/mL in the control and epileptic groups, respectively. Compared with the control group, the levels of inflammatory cytokines TNF-α, IL-1β, IL-2, IL-6, and ICAM-1 in peripheral blood of patients in the epilepsy group were significantly increased, while IL-10 in the epilepsy group was significantly decreased () (Figure 4).
(a)

(b)
(c)

(d)

(e)

(f)
3.5. Changes in Peripheral Blood miRNAs Levels
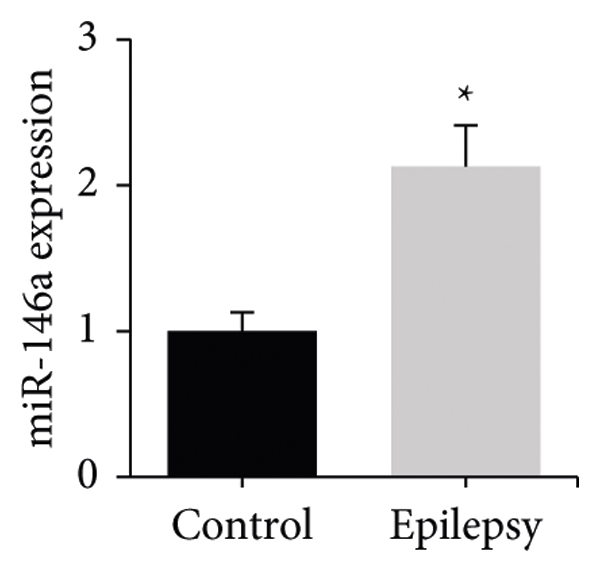
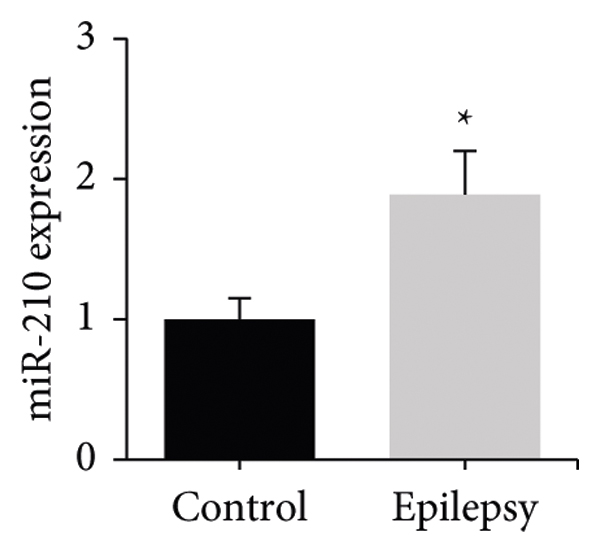
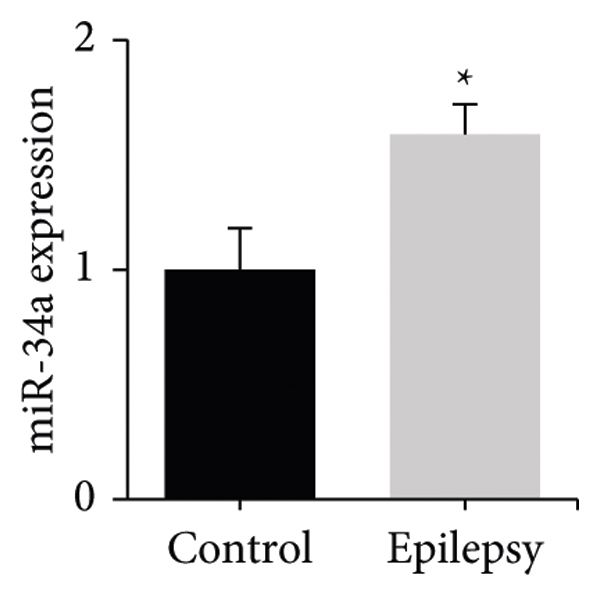
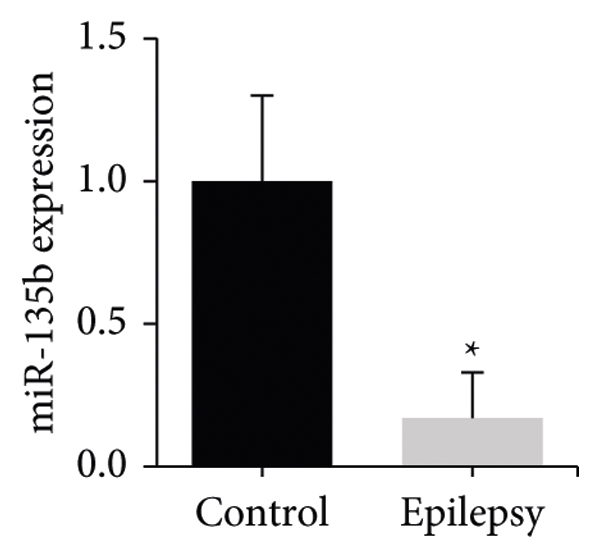
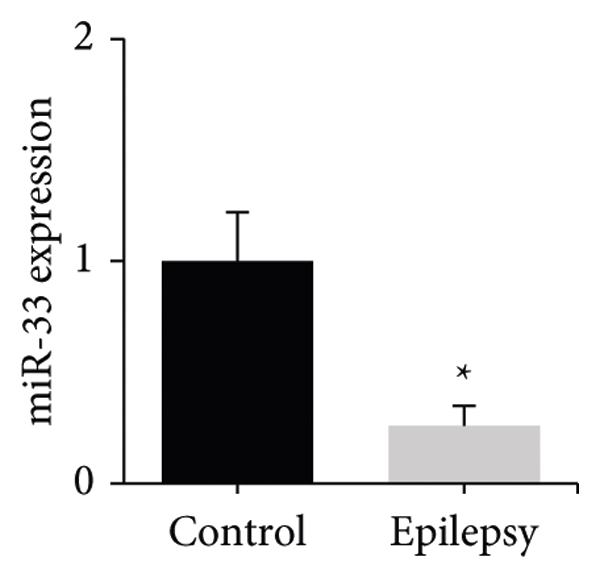
The differences in peripheral blood miR-146a, miR-210, miR-221, miR-34a, miR-135b, and miR-33 levels between the two groups were compared. The peripheral blood miR-146a levels were (1.00 ± 0.13) and (2.14 ± 0.28), miR-210 levels were (1.00 ± 0.15) and (1.89 ± 0.31), miR-221 levels were (1.00 ± 0.20) and (2.44 ± 0.35), miR-34a levels were (1.00 ± 0.18) and (1.59 ± 0.13), miR-135b levels were (1.00 ± 0.31) and (0.17 ± 0.16), and miR-33 levels were (1.00 ± 0.22) and (0.26 ± 0.09) in the control and epileptic groups, respectively. Compared with the control group, the levels of miR-146a, miR-210, miR-221, and miR-34a in the peripheral blood of patients in the epilepsy group were significantly increased, while the levels of miR-135b and miR-33 in the epilepsy group were significantly decreased () (Figure 5).
(a)
(b)

(c)
(d)
(e)
(f)
4. Discussion
Epilepsy is one of the very common diseases in neurology, which has paroxysmal, repetitive, and transient characteristics, but the pathogenesis of this disease is not clear at present [13]. The characteristics of the brain in patients with TLE were analyzed using MRI techniques, and it was found that the patients developed significant hippocampal atrophic lesions, and HCT2 in the bilateral hippocampus was significantly increased. Studies have confirmed that there is a close relationship between hippocampal atrophy and neuronal loss and gliosis [14]. Increased HCT2 values may be due to pathological basis such as neuronal loss and proliferation of glial cells in the hippocampus of TLE patients [15]. In addition, evidence shows that peripheral blood T lymphocytes are involved in the process of epilepsy, especially TLE with hippocampal sclerosis [16]. The results showed that the proportion of CD3+ and CD4+ cells in peripheral blood T lymphocyte subsets was significantly increased, while the proportion of CD8+ cells was significantly decreased in TLE patients compared with normal subjects. Pitsch et al. [17] concluded that CD8+ T lymphocytes can specifically target the expression of OVA and cause apoptotic neurodegeneration, astrogliosis, and microglial activation, and maybe the cause of hippocampal sclerosis with TLE after marginal encephalitis. This suggests that the level of T lymphocyte subsets in the peripheral blood of TLE patients is found to be disturbed, which may be related to abnormal structural changes such as hippocampal atrophy.
TNF-α belongs to a class of inflammatory cytokines with multiple biological effects, which can induce epileptic discharges by stimulating glutamate and then affecting hippocampal CA3 pyramidal cells in the central nervous system, inhibiting the postsynaptic potential activity of nerve, and leading to epileptic discharge [18]. The results showed that the levels of TNF-α, IL-1β, IL-2, IL-6, and ICAM-1 in the peripheral blood of TLE patients were significantly increased, while the level of IL-10 was significantly decreased. Yang et al. [19] detected the changes of TNF-α and IL-6 levels in peripheral blood of children with epilepsy and found that the levels of TNF-α and IL-6 in T lymphocytes were significantly increased in the child. Liu et al. [20] detected the changes of serum inflammatory markers IL-2, IL-6, and hs-CRP levels in children with epilepsy and found that the serum levels of IL-2, IL-6, and hs-CRP in children were significantly increased, while sodium valproate combined with levetiracetam treatment could reduce the levels of these markers. Leo et al. [21] demonstrated that anti-IL-6R antibodies were effective in reducing the number of absence seizures and depression-like behavior in a rat model of convulsive epilepsy, and they concluded that IL-6 plays an important role in seizure induction and seizure process. Basnyat et al. [22] demonstrated that serum levels of IL-10 were significantly lower in patients with refractory TLE and that IL-10 levels showed a negative relationship with the course of epilepsy. The above-given results suggest that inflammatory mediators are involved in the process of TLE disease, which may be involved in the regulation of epileptogenesis through processes such as activation of glial cells, changes in gene expression levels, and neuronal loss.
Studies have confirmed that miRNAs have a close relationship with the function of the nervous system. MiR-146a and miR-221 are miRNAs that regulate the generation of inflammatory factors [23]. In response to IL-1β stimulation, miR-146a and miR-221 are upregulated and can promote the expression of downstream multiple classes of inflammatory factors as well as adhesion factors. MiR-34a belongs to miRNA that regulate the expression of apoptotic factors [24]. The results showed that miR-126a, miR-221, and miR-34a were up-regulated in the peripheral blood of TLE patients. These results suggest that miRNAs can participate in the process of TLE by regulating the release of inflammatory factors and the expression of apoptotic factors. In addition, the expression levels of miR-210, miR-135b, and miR-33 in peripheral blood of TLE patients were further detected. Chen et al. [25] confirmed that miR-210 showed a high expression level in the hippocampus of epileptic animal models, while inhibition of miR-210 expression was able to inhibit seizure-induced apoptosis. Li et al. [26] showed that miR-135b-5p expression levels were significantly lower in children with TLE, and overexpression of miR-135b-5p was able to target SIRT1 to reduce apoptosis after epilepsy. Hu et al. [27] explored the expression profile of miRNAs in TLE rats, and miRNA microarray revealed 9 up-regulated miRNAs such as miR-146a and mR-210 and 15 down-regulated miRNAs such as miR-135b and miR-33. This is consistent with the results that miR-210 expression was up-regulated and miR-135b and miR-33 expression was down-regulated in peripheral blood of TLE patients.
5. Conclusion
TLE patients are usually accompanied by pathological changes in the hippocampal formation, and peripheral blood T lymphocyte subsets disorders, the release of inflammatory cytokines, and regulation of miRNAs expression are involved in seizures and neuronal damage. The changes of MRI image characteristics and serum biological indicators in patients with TLE were detected, and the correlation between MRI image characteristics and serum biological indicators was not deeply explored. Peripheral blood samples were collected from patients to detect the expression levels of various indicators. In subsequent studies, tissue or cerebrospinal fluid samples will be collected for analysis of changes in lymphocytes, cytokines, and miRNAs, and their mechanism of action on the degree of neurons will be analyzed. In conclusion, patients with TLE have hippocampal lesions, which may be associated with imbalances in peripheral blood T lymphocyte subsets, chronic inflammatory responses, and abnormal miRNA expression. The results can provide experimental materials for understanding the pathogenesis of TLE, as well as the search for therapeutic targets.
Data Availability
The data used to support the findings of this study are available from the corresponding author upon request.
Conflicts of Interest
The authors declare that there are no conflicts of interest.