Abstract
In this study, wavelet-based damage-sensitive features are employed to derive the seismic fragility functions/curves for reinforced concrete moment-resisting frames. Two different wavelet transform functions, namely, Bior3.3 and Morlet mother wavelet families, were applied to absolute acceleration time histories of building frames to extract the wavelet-based and refined wavelet-based damage-sensitive features (i.e., DSF and rDSF). The accuracy of seismic assessments and certainty in predicting structural behavior strongly depend on the specific optimal intensity measures selected, reliability of wavelet-based damage-sensitive features, and some such intensity measures as PGA, PGV, PGD, Sa, and Sdi as the conventionally utilized measures to detect the damage state of a structure. These measures were examined against their statistical properties of efficiency, practicality, proficiency, coefficient of determination, and sufficiency to select the appropriate optimal intensity measures, which were then used to drive the fragility curves disclosing the failure or other damage states of interest. For the purposes of this study, three different concrete moment-resisting frames with four-, eight-, and twelve-story building frames were adopted for implementing the proposed approach. The findings demonstrate that the wavelet-based damage-sensitive features (DSFs/rDSF) simultaneously satisfy all the statistical properties cited above. This is evidenced by the low variance and dispersions observed in the frame damage state predictions by the fragility functions derived from the wavelet-based DSF when compared with those derived from the classical fragility analyses such as spectral acceleration at the first mode period of the structure. A final aspect of the study concerns the superior performance and efficiency of the fragility curves derived by the Bior3.3 wavelet-based DSF over those derived from Morlet wavelet-based DSF.
1. Introduction
Earthquakes with their calamitous consequences are recognized as one of the most tragic natural disasters that are not only unpredictable but highly destructive with high casualties and death tolls. The human and financial losses associated with earthquake events, as well as their frequent incidences have encouraged civil engineers to focus concerted efforts on mitigating the associated risks and hazards. These efforts have generally led to studies focused on risk assessment and seismic response of buildings using a wide variety of analytical, numerical, and experimental methods to identify key parameters contributing to such earthquake-induced risks and hazards in structural systems [1–9]. To this end, building codes and guidelines have been developed to ensure maximum structural safety by enforcing constraints in the design and maintenance of structures. An outstanding outcome of such endeavors in the last few years is the performance-based earthquake engineering (PBEE) design approach [10–15]. In PBEE, the seismic vulnerability assessment of structures is accomplished by quantitating damage probability under different levels of potential earthquake events [16, 17].
While the probability of incidence of a specific damage state (DS) versus selected engineering demand parameters (EDP) is dealt with in the PBEE framework to support the structural design decisions in accordance with the desired performance objectives, the structural health monitoring (SHM) and different damage diagnosis methods focus on the detection of invisible damages or hidden deficiencies in the different structural elements to be extracted from structural responses during the normal operation of a structure [5, 18, 19]. In this regard, fragility functions can be employed in SHM to categorize the damage state (DS) in a structure or utilized in PBEE as a forecasting tool of structural performance [20–22].
The present study introduces a novel approach that draws on the wavelet-based damage-sensitive feature (DSF) as a measure of the seismic performance of structures to develop fragility functions for classifying and/or predicting structural damages. To extract the wavelet-based DSF, the floor levels’ absolute acceleration responses of the structures during a ground motion excitation were collected. The structural responses were then calculated via nonlinear incremental dynamic analysis (IDA) that comprises a number of earthquake excitations scaled to various intensities and applied to a structure [23, 24]. The damage states of the structure were then determined after the maximum story drift ratio (SDR) for each story was found [25–27]. This was followed by the extraction and refinement of the acceleration responses of the models before the wavelet transform could be employed to calculate the energies of wavelet coefficients [25, 27–34]. Although this method is less intuitive, it is claimed to be reliable and computationally efficient [27, 35, 36].
Some prestigious studies have been recently reported on the application of wavelet-based DSF not only for damage diagnosis in steel moment-resisting and steel-braced frames [26, 27, 32, 34, 36–40] but also for the development of fragility functions/curves for steel frames [22, 38, 41, 42]. However, the effectiveness of DSF in association with the wavelet transform method with respect to SHM and PBEE of concrete moment-resisting frames (MRFs) remains yet to be investigated. In other words, the scope of the literature on wavelet-based DSF has been limited only to damage diagnosis in steel structures, with no due heed paid to concrete structures. To fill this gap, the present study aims to employ a novel framework that combines the features of SHM and PBEE to develop fragility functions for concrete MRFs using two different mother wavelet families and wavelet-based DSF. The proposed framework was initially introduced by Noh et al. [38] and further developed by Yazdanpanah et al. [41, 42] and Mohebi et al. [43]. As accurate seismic assessments and reliable structural performance predictions strongly depend on the optimal intensity measures (IMs) selected, efforts are made in this study to examine their reliability against certain statistical properties of wavelet-based DSF and some conventional intensity measures commonly used to diagnose the damage state (DS) of a structure.
For the purposes of this study, three different concrete MRFs of four-, eight-, and twelve-story building frames were selected to implement the proposed approach. Furthermore, the refined wavelet-based damage-sensitive feature (rDSF) was used to capture the higher-mode contributions of midrise and high-rise buildings. To formulate the damage states, different seismic ground motion records were subsequently exploited to extract absolute acceleration responses of concrete MRFs via IDA. Using the fragility functions thus obtained, the probability of the incidence of a specific damage state (DS) was determined. The results of this study are presented in relevant charts and tables that can be easily used by practical engineers.
2. Methodology
Following Nair and Kiremidjian [32] and Nair et al. [44], numerous studies have been conducted over the years toward the successful application of the wavelet transform, particularly in its continuous form. The capabilities of the wavelet transform and the associated wavelet-based DSF in capturing nonstationary characteristics of earthquake events and structural responses make it one of the most favorable methods of widespread use in SHM. It has been shown that different CWT functions and observations of acceleration responses of structures subjected to earthquake ground motions can be employed to determine the instantaneous properties of structures [45–48]. Furthermore, wavelet-based DSF and rDSF as defined by CWT of acceleration signals have been developed with the help of signal processing techniques.
In this study, a new framework based on wavelet-based DSF and rDSF is introduced for the development of fragility functions for reinforced concrete MRFs subjected to different earthquake ground motions. DSF and rDSF measure alterations in wavelet energy at the undamaged structure’s natural frequency as damage develops. It has been shown that the conventional wavelet-based DSF yields better estimations of the damage state (DS) in low-rise buildings while the counterpart rDSF is more appropriate to capture the higher-mode contributions in midrise and high-rise buildings [36, 39, 40, 49, 50]. To illustrate the performance of the wavelet-based DSFs as damage indicators, absolute acceleration measurements were correlated and compared with story drift ratios (SDRs), and damage states were estimated based on the maximum story drift ratios of the frames.
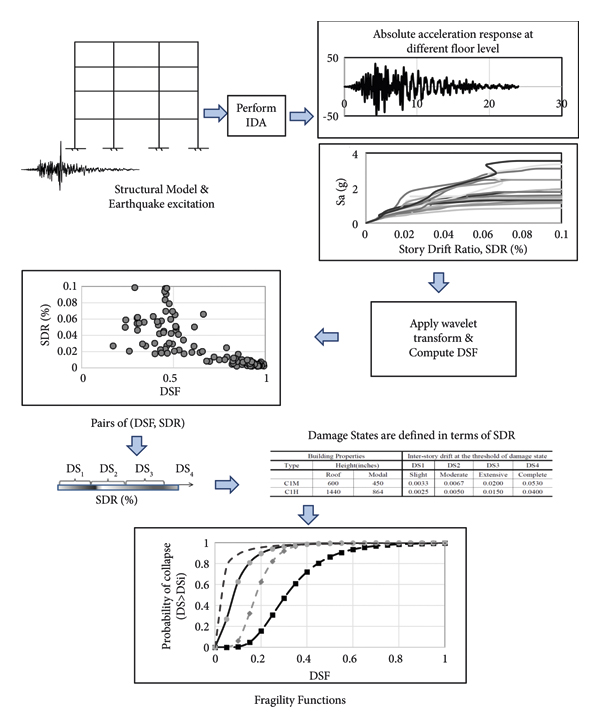
The combined framework of SHM and PBEE is implemented via the following main computational steps. Initially, the absolute acceleration responses of the models subjected to different earthquake ground motions are extracted using nonlinear incremental dynamic analysis. The second step involves the derivation of the damage-sensitive features (DSFs and rDSFs) using wavelet coefficients of acceleration signals. This is followed in the third step by the development of a prediction model and classification of damage states through constructing fragility functions. Once these steps are completed, correlations are established among the fragility functions, damage states, engineering demand parameters (EDPs), and intensity measures (IMs) of the seismic ground motion. Figure 1 depicts the abovementioned steps while their descriptions will be provided in the following subsections.
2.1. Extracting Acceleration Responses of the Models via Nonlinear Incremental Dynamic Analysis (IDA)
The procedure for conducting IDA includes subjecting a structure model to a number of ground motions of various intensities adopted from the PEER ground motions database, performing the analysis, and generating the intended structural responses in the processing stage [23, 24].
In this study, the seismic behavior of reinforcedconcrete MRFs under various earthquake ground motions was analyzed using IDA. For this purpose, 2D numerical models of the structures were generated in the OpenSees software. By compiling the responses of the structural models through the nonlinear incremental dynamic analysis, the floor levels’ absolute acceleration responses of the structures were extracted. In this study, a normalization procedure as shown in the following equation was utilized before applying the wavelet transformation to the input signal to use the time-history acceleration responses [27, 32]. This procedure involves the subtraction of the mean value mean ((t)) from the absolute acceleration response of (t) and dividing the resulting value (numerator) by the root mean square RMS ((t)) value (denominator).where the number of data points denotes the absolute acceleration response of (t) with N. Subtracting the time-history acceleration responses from the mean value offsets the different initial conditions of the data collection process. In addition, the effects of different loading intensities were reduced by dividing the value of the calculated nominator by the RMS value (i.e., the denominator).
2.2. Derivation of Damage-Sensitive Features (DSFs and rDSFs) Using Wavelet Coefficients of Acceleration Signals
In this step, the absolute acceleration responses recorded for each story level in the previous step were introduced into the MATLAB software, and the wavelet transform was employed to calculate the matrix of wavelet coefficients. In the classical application of CWT, the wavelet scale and shift are denoted by a and b, respectively. Since wavelets are localized waves with finite time durations, the application of the CWT represents time-varying characteristics of the input acceleration responses. In other words, CWT provides the time sum of the entire input signal multiplied by a form of the scaled and transferred mother wavelet. This process produces a wavelet coefficient that is a function of scale and time. There are eight steps to make the continuous wavelet transform which are listed as follows:(1)A mother wavelet function is utilized for calculating the wavelet transform.(2)The chosen wavelet, along with the specified scale parameter, is applied to the beginning of the target signal.(3)The similarity between the wavelet function and the signal is assessed. In this step, the wavelet coefficients are calculated.(4)The wavelet function is then shifted to the right (continuing along the signal) while maintaining the same scale parameter.(5)Steps 3 and 4 are iterated until reaching the end of the signal’s time domain.(6)The scale parameter value is incremented, shifting towards the start of the signal. During this process, the wavelet function widens until it approaches zero.(7)Steps 2–6 are repeated to cover all scales.(8)The results of the calculations are organized into a matrix containing wavelet coefficients.
The steps mentioned enable finding the continuous wavelet coefficients. Wavelet analysis magnifies minor signal changes, significantly.
The previous study by the authors showed that the optimal wavelet family of the concrete MRFs was Bior3.3, leading to more accurate damage estimates. Thus, the wavelet coefficients are determined by selecting Bior3.3 as the mother wavelet. Once the wave with the same scale is transferred to the end of the signal, the procedure for calculating the wavelet coefficients should be repeated, and all the previous steps should be performed anew when a given scale is changed. In this way, the continuous wavelet coefficients are determined at the end of these steps. Since damages change the original form of the acceleration signal, the wavelet analysis method can be used for SHM. The continuous wavelet coefficient is mathematically expressed as follows [51]:where ψ denotes the mother wavelet and characterizes a complex conjugate used to compute the wavelet coefficients of [51]. Moreover, is the time-history acceleration response with the wavelet parameters a and b denoting the wavelet scale and shift, respectively.
Nair and Kiremidjian [32] were the first to introduce Escale(a), which represents the wavelet energy at a specific scale (Escale(a)). It shows the distribution of vibration energy in the acceleration response across different scales. Once, the wavelet coefficients are determined, the wavelet coefficient energy at scale a can be computed for each output signal. The energy of the wavelet coefficient is given by the following equation [32]:where the term K denotes the number of data points in the signal and |.| represents the absolute value of .
The square of the absolute of the wavelet coefficients is called the scalogram, referred to as wavelet energy at scale a and time-shift at scale b. Thus, Escale(a) is the sum of all the wavelet energies over time at scale a. To express the relationship for scale a in a discrete time-series acceleration response, the central mother wavelet frequency (Fc), sampling frequency (Fs), natural frequency of the undamaged structure (Fn), and the sampling time (Δt) are correlated with each other as the following form of equation (4) [41]:
The centfrq function calculates and returns the center frequency ( in Hz) of any arbitrary wavelet family by specifying the wavelet name using MATLAB software. Using the mathematical relations for wavelet coefficient energy, wavelet-based DSF and rDSF can be determined from wavelet energies to predict damage states in structures.
DSF monitors changes in wavelet energy at the undamaged structure’s natural frequency during the progression of damage. Noh et al. [38] introduced DSF based on a CWT algorithm. The mathematical relation for the DSF based on a CWT is expressed as follows:where Escale(a), as defined by Nair and Kiremidjian [32], is the wavelet energy at scale a over time. To calculate , the wavelet energies at scales a (related to the first natural frequency of the undamaged structure) and 2a (correspond to half of that) should be added up with each other. Hence, the total energy can be written as
In equation (5), the numerator represents the wavelet energy at a specific scale related to the first natural frequency of the structure. This term captures the dominant response of the undamaged structure. The denominator includes additional terms to calculate the total wavelet energy (). However, it is important to note that this additional term in the case of undamaged structure has negligible contributions compared to the main term in the numerator. As structural damage progresses, the dominant scale of acceleration response shifts, leading to a decrease in the DSF value by increasing the contribution of additional terms of the denominator of equation (5). Therefore, in the normalized form of DSF, this value varies between 0 and 1, i.e., 0 ≤ DSF ≤ 1.
Hwang and Lignos [34] discovered that considering the wavelet energies corresponding to the building’s first three natural frequencies is generally sufficient to capture higher-mode effects on its seismic response. Assuming well-separated natural frequencies, the second-mode and third-mode frequencies were estimated at 3 and 5, respectively [36]. By analyzing the logarithmic difference in acceleration response power distribution, Hwang and Lignos [39] observed a shift in power distribution at the second and third modes to 2 and 4.5 and developed the rDSF using the following equation:
It is worth noting that Hwang and Lignos [39] proposed the second-mode and third-mode frequencies of steel frames as multiples of the first natural frequency, i.e., = 2 and = 4.5. In addition, it is worthwhile to mention that the fundamental principles governing the dynamic behavior of structures, such as modal frequencies and mode shapes, are inherently influenced by the material properties of the structure and its overall geometry. Therefore, using frequency characteristics developed for steel frames, namely = 2 and = 4.5, may lead to approximate solutions for reinforced concrete MRFs. The calculation of higher-mode frequencies for different structures and correlating these frequencies with the first natural frequency requires significant time and effort, which is beyond the scope of this study and could be considered for future investigations. Consequently, the calculation procedure for rDSF aligns with the findings of Hwang and Lignos [39]. Readers should be aware of the potential limitations of this study and interpret the results accordingly. Taking into account the magnitude associated with 0.5, 2, and 4.5, Escale(a), the overall energy of the wavelet, , is adjusted in the following manner:
Similarly, in equation (7), the numerator sums the wavelet energies at frequencies corresponding to the first three natural frequencies of the structure. These terms capture higher-mode effects on seismic response. The denominator accounts for the total wavelet energy at all considered frequencies. Despite including additional terms, the dominant contributions of the energies of wavelet corresponding to the undamaged state of structure come from the main terms in the numerator related to the first three natural frequencies. As damage increases, the rDSF value decreases, reflecting changes in the structural response due to evolving damage states. Hence, in the normalized form of rDSF, this value varies between 0 and 1, i.e., 0 ≤ rDSF ≤ 1. Based on the normalization approach and the dominance of key terms in the numerator of DSF and rDSF calculations, both ratios can reach unity (1) in the limit state, indicating no damage in the structure. In addition, by progressing the damage states and increasing the contribution of additional terms of , DSF/rDSF can relatively reach zero representing a severe damage state. In view of the abovementioned considerations, the wavelet-based damage-sensitive features (DSFs and rDSFs) were extracted from the absolute acceleration data for each floor of a structural system.
2.3. Selection of Optimal Intensity Measures in Probabilistic Seismic Demand Models
Different probabilistic seismic demand models (PSDM) have been developed to specify the conditional probability relationships among engineering demand parameters (EDPs) exceeding predefined values (, which can be mainly in the form of either maximum or residual demand) subjected to various seismic intensity measures (IMs). Following the pioneering studies of Shome [52] and Cornell et al. [53], some studies proposed conditional seismic demands using the lognormal distribution function (Cornell [54], Tothong and Luco [55, 56], Padgett et al. [57], Wang et al. [58], Khosravikia and Clayton [59], Babaei et al. [60], and Li et al. [61]. Herein, we draw upon Cornell et al. [53] who may be consulted for more detailed explanations.
The probabilistic seismic demand model in the lognormal distribution form can be expressed as follows:where D characterizes the random variable for structural demand analysis and d represents a threshold (i.e., a specific value) of the structural demand level interested in calculating the probability of exceedance. The standard normal cumulative distribution function, the median value of the structural demand in terms of seismic intensity, and the logarithmic standard deviation of the demand conditioned on IM are represented by Φ(.), , and βD|IM, respectively. The following equation shows the correlation between median structural demand () and intensity measure (IM) [57, 58]:where A and B are linear correlation coefficients defined as the width from the origin and the slope of the line, respectively.
The linear data regression is generated by conducting time-history analyses on the structural models subjected to a given number of seismic earthquake ground motions (N). Subsequently, both the regression parameters and the logarithmic standard deviation term (namely, βD|IM) are estimated from the plot of peak demands versus ground motion intensity. The conditional form of the standard deviation of the regression can be written as shown in the following equation [57, 58]:
One advantage of using an appropriate IM is the more precise evaluations of seismic performance obtained without the need to go through a detailed ground motion record selection process prior to the nonlinear dynamic structural analyses involved in probabilistic seismic demand analysis (PSDA). However, reasonably selected seismic IMs are crucial for improving the capability of PSDMs in capturing structural seismic responses. It is worth noting that the probabilistic functions of tremor demand express the relationship between maximum responses and intensity parameters. Therefore, the accuracy of seismic assessment and certainty in structural performance prediction both strongly depend on the optimal intensity measures (IMs) selected. Among all the intensity parameters, the most optimal ones are those that enjoy better relationships with the response parameter and a higher capability for predicting the exact damage level.
Due to the concepts inherent to PBEE, the selection of an optimal intensity parameter enhances the reliability of analytical results. Furthermore, a number of characteristic IMs reported in the literature should be examined to ensure that optimal IMs are selected for assessing structural performance via PSDA. Based on the statistical properties and PSDM formulations, different well-known characteristic measures including efficiency, practicality, proficiency, coefficient of determination, and sufficiency have been proposed in the literature for assessing the adequacy of the seismic IMs [55, 57, 58, 62–68]. For the thoroughness and consistency of the present research, the aforementioned statistical quantities will be briefly introduced below.
2.3.1. Efficiency
Efficiency is the most readily examined metric in characterizing seismic IMs and reflecting the variations in structural demand generated for the given IMs. To assess the efficiency of different IMs, the main measure of logarithmic standard deviation of the seismic demand (βD|IM) and the auxiliary metric of the coefficient of determination () can be used. The efficiency can be quantified using βD|IM obtained from equation (11). An efficient IM decreases the variations in the structural demand (less dispersion/changes) generated for the given IMs. Consequently, less dispersion can be observed about the estimated median in the structural responses by a lower logarithmic standard deviation of the seismic demand (i.e., βD|IM) [57, 62, 64]. A careful examination of the literature on the efficiency metric reveals that the selected IM may be considered efficient if 0.1 < βD|IM < 0.3.
The auxiliary indicator, coefficient of determination (), is another measure that can be used to evaluate how the regression line in equation (10) correlates with the data. The coefficient of determination () is always between 0 ≤ ≤ 1. A higher value of confirms the effectiveness of demand-IM pairs and less dispersion among the data [58, 60, 69]. In addition, a higher value signifies reduced variability among the data, thus quantifying the efficiency characteristic. If the coefficient of determination () is too small, the selected IM is not sufficiently effective, thus relaxing the need for calculating the other statistical metrics [60]. It should be noted that in determining efficiency, the value of βD|IM takes precedence over the value of . In other words, the values of βD|IM are superior to , leading to the determination of an efficient IM first based on βD|IM, and second based on .
2.3.2. Practicality
Practicality is a predictor of the dependency of the engineering demand parameter (EDP) on the IM investigated. This metric demonstrates the degree of dependence such that if an intensity measure IM is not practical, no direct correlation can be found between IM and EDP. The practicality indicator can be quantitated from the slope of the regression line (B) between the demand parameter and the measure of earthquake intensity in the logarithmic space, as shown in eqution (10). A practicality value of the regression line (B) close to 0 demonstrates a negligible correlation between IM and EDP, indicating an impractical IM. In contrast, higher values indicate the applicability of the selected IM [57–59, 62, 64].
2.3.3. Proficiency
The composite proficiency measure, originally due to Padgett et al. [57], is a combination of the efficiency and practicality metrics. These authors found that the efficiency or practicality measures considered individually might lead either to biases in the balance among the different factors involved or to inappropriate selection of an IM. It was also observed that a more proficient IM is characterized by a lower dispersion, ζ, that reflects the level of uncertainty using a specific IM in the analysis [57, 59, 61]. The modified dispersion, ζ, can be defined by substituting equation (10) into equation (9), resulting in a simplified expression.
By using this particular form of the PSDM equation, it becomes easier to substitute regression coefficients and determine the values of proficiency or modified dispersion as follows:
The value for ζ expressing the proficiency measure is a combination of the dispersion value expressing efficiency and the slope of the practicality regression line. Lower values of ζ signify a more proficient IM, representing a lower uncertainty in the demand model as a result of the IM selected [57, 59, 61].
2.3.4. Sufficiency
The sufficiency of an IM demonstrates its appropriateness for use in PSDMs [57, 62, 65]. The sufficiency discusses the conditionally statistical independence of an IM to earthquake characteristics including earthquake magnitude (M) and epicentral distance (R). Indeed, variations of ground motion magnitude and epicentral distance of a sufficient IM should have only a negligible systematic impact on the seismic engineering demand parameter selected. Sufficient IMs would, therefore, result in the proper estimation of the overall probability of exceedance in PSDA [59, 60]. This metric, quantitated by the p value first introduced by Ang and Tang [70], can be determined via regression analysis of the residuals between the actual structural response and the predicted PSDM related to the earthquake magnitude or epicentral distance (εd|IM) [71]. The value is a statistical measure used to assess the strength of a variable or parameter against the null hypothesis. In regression analysis, the value indicates the probability of observing the data or something more extreme if the null hypothesis is true. A small value of the linear regression of the residuals on earthquake magnitude or epicentral distance represents the insufficiency of a given IM, and the chosen seismic intensity measure is inadequate in accurately predicting the structural response. Meanwhile, the value might be related to the probability of rejecting the null hypothesis in an analysis of variance leading to a coefficient of regression equal to 0 [66]. In this regard, a small value of the linear regression of the residuals indicates a higher statistical dependency, which again signifies an insufficient IM [70–72] and implies that the IM does not capture all the relevant information needed to predict the structural response, effectively. Following Ang and Tang [70], Padgett et al. [57], and Wang et al. [58], the widely used significance level of 5% ( value = 0.05) was used in the present study; this value is more common for most practical engineering applications. Therefore, seismic IMs that render values below the threshold value will be considered to be insufficient for reliably predicting the structural response.
2.4. Fragility Functions Developed Using DSF and rDSF
Fragility functions reveal the probability of a structure to undergo a collapse or other damage states of interest as a function of seismic ground motion intensity measures (IMs) [21, 52, 73–76]. For the present purposes, these functions were developed using the wavelet-based DSF and rDSF as damage classification models in order to determine the conditional probability of a building being in, or exceeding, different damage states relative to the selected threshold values of damage-sensitive features.
Damage states of buildings are classified into different categories based on the building height. According to the HAZUS–MR5, reinforced concrete MRFs are denoted by the symbol C1, and building frames are identified as high-rise, midrise, and low-rise, represented by H, M, and L, respectively [77]. For instance, high-rise reinforced concrete MRFs will be denoted by C1H. Thus, the four-story building frame under consideration is represented by C1M, while the other two frames belong to the category of C1H. Table 1 presents the building frame classification based on HAZUS–MR5.
To classify the damage states of structures, absolute acceleration measurements were correlated with the relevant story drift ratios (SDRs), and the corresponding damage states were estimated using the maximum story drift ratios of the frames. Thus, a set of threshold SDR values as reported in HAZUS–MR5 is specified for each damage state (DSi); the list is presented in Table 2 [77].
To develop fragility functions, four damage states, termed slight, moderate, extensive, and complete depending on the relevant structural failure, were defined for the concrete MRF in terms of SDR at each story. Each damage state (DSi) covers a range of SDR values reported in Table 2 and is rewritten as where SDR is the story drift ratio and n is the number of damage states. Application of the fragility functions and the abovementioned definitions of damage states yields quantified conditional probabilities for a structure being in, or exceeding, different damage states relative to the selected threshold values of damage-sensitive features [38]. Hence, the fragility functions can be calculated as where, is the fragility function for damage state i being in, or exceeding, the threshold value of .
The fragility functions derived from DSF and rDSF for a structure can be calculated in either of the two ways: (1) based on the individual story responses, or (2) for the entire structure using the roof responses and the maximum SDR among all the stories [38]. Pairs of DSF and SDR values ( and ) were computed in the present study for the acceleration responses at each floor based on the numerical models of the structures being considered and the structural damage diagnosis algorithm.
3. Problem Definition
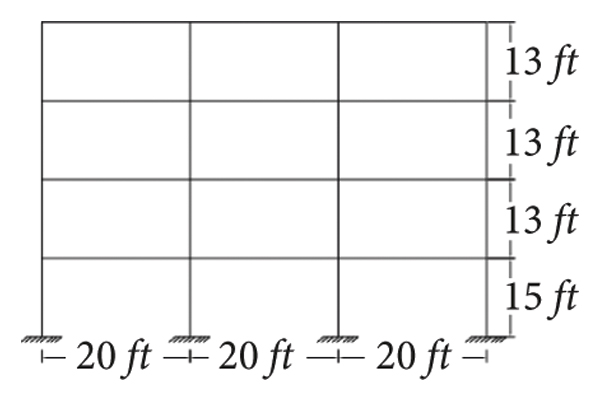
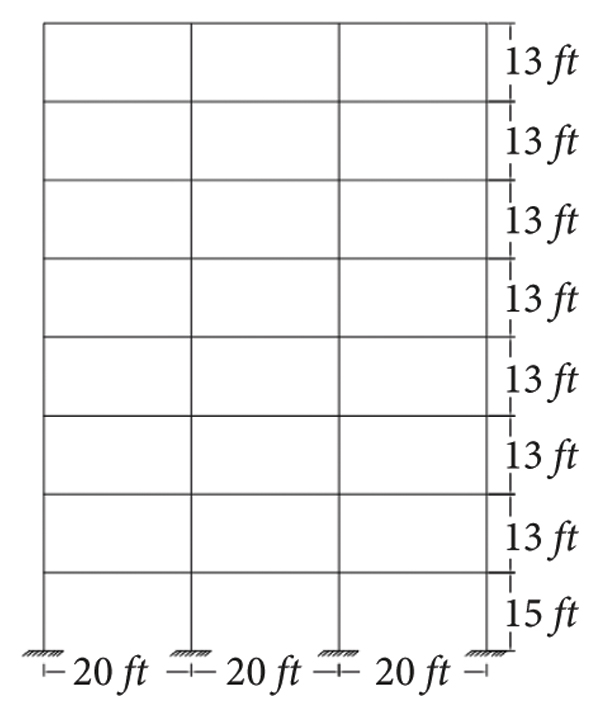
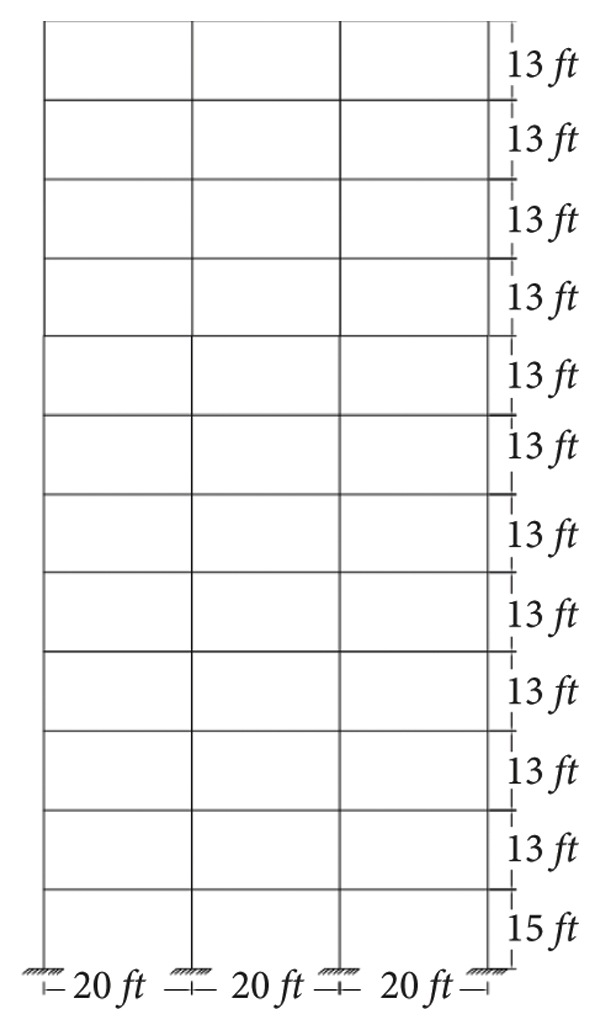
Two-dimensional (2D) nonlinear representation models of reinforced concrete MRFs with a special ductility value subjected to the east-west (E-W) loading direction of different building frames, namely, four, eight, and twelve stories were simulated in OpenSees software. It is worth noting that the modeled frame has a space-frame system. To assess the collapse performance of the abovementioned MRFs, nonlinear analysis models were used with lumped plasticity beams, column elements, and finite joint shear panel springs. The model elements of the beam-column plastic hinges were simulated as described by Ibarra [73] and, further, implemented into OpenSees, following Altoontash [78], to capture the important modes of monotonic and cyclic deterioration. More detailed descriptions of the simulation procedures may be found in the studies of Haselton [74] and Haselton et al. [79]. Table 3 and Figure 2 present the frame geometries and dimensions used in this study. For a more in-depth explanation of the modeling and design process, readers are encouraged to scrutinize the influential study of Haselton and Deierlein (2008) [80]. Haselton and Deierlein (2008) presented comprehensive structural modeling and design for special reinforced concrete building frames with four, eight, and twelve stories, identified by building design IDs “1008, 1012, and 1014,” respectively.
(a)
(b)
(c)
All of the abovementioned building frames were designed by IBC 2003 [81], ASCE 7-02 [82], and ACI 318-02 [83]. Absolute acceleration responses were extracted at the floors of concrete MRFs using incremental dynamic analysis (IDA) to formulate the damage states. The building frames were subjected to the seismic earthquake ground motions listed in Table 4 in the appendix.
To validate the proposed analytical method and the calculation procedure, the first mode period times of different reinforced concrete frames were compared with those of Haselton and Deierlein [80] to find a good agreement between them (Table 5). While the modeling approach was inspired by Haselton and Deierlein (2008), the authors acknowledge that there could be discrepancies in the assumptions related to unit conversions (dimension, force, and stress), and the accuracy of analysis used to determine the first mode period. However, the deviations observed in the first mode period between this study and those of Haselton and Deierlein (2008) remain always less than 2.5%, which falls within an acceptable range of variation.
After simulating the structural models of reinforced concrete MRFs, the incremental dynamic analysis (IDA) was performed to evaluate the corresponding maximum SDR of each ground motion record and all the seismic ground motion intensities up to the incidence of structural collapse [53, 54]. It is worth mentioning that the intensity of each ground motion record, Sa (T1), was incrementally scaled in the IDA calculation procedure to reach the collapse state. To this end, a threshold value of 0.1 was considered as the maximum SDR [49, 84]. The Hunt and Fill algorithm was utilized to find the damage states of each structure through IDA [77]. Figure 3 demonstrates the IDA curves of the 4, 8, and 12 reinforced concrete MRFs studied.
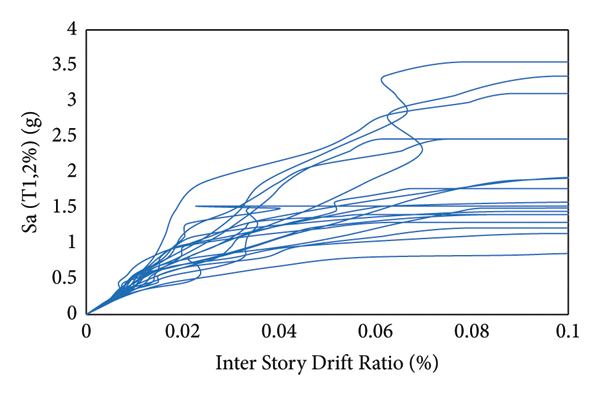
(a)
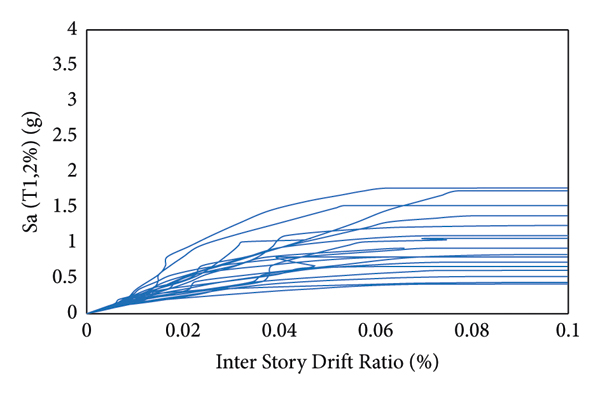
(b)
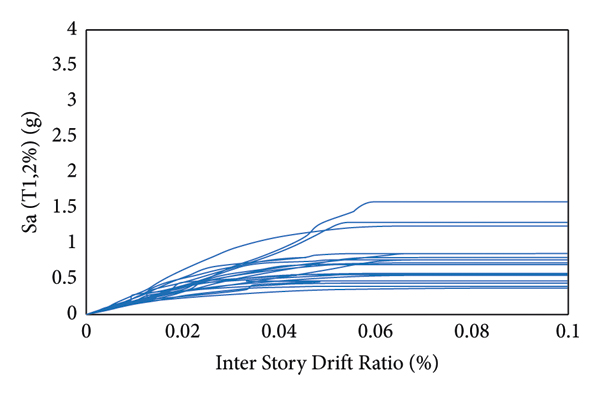
(c)
4. Results and Discussion
4.1. Derivation of DSF Using Wavelet Coefficients of Acceleration Signals
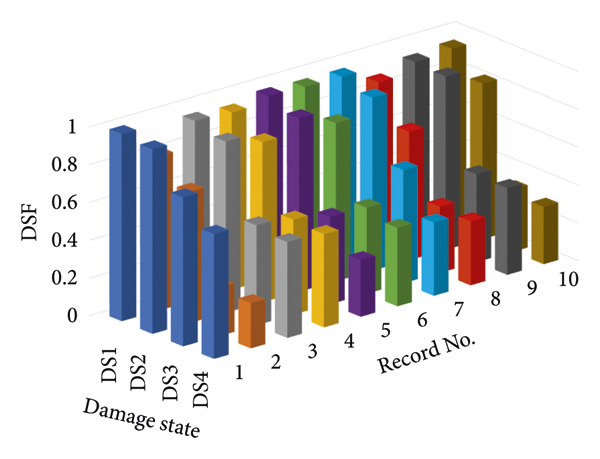
Figure 4 demonstrates the variation of DSF values based on the time-history responses of absolute accelerations for different damage states at the roof level of the 4-story building frame subjected to 10 seismic ground motions. It is worth mentioning that in Table 4, 20 ground motion records were initially reported to develop fragility curves using wavelet analysis. However, only the first 10 ground motion records were depicted in Figure 4 for the charts illustrating variations in DSF for each damaged state of the 4-story building frame. This decision was made to provide a clearer and more focused representation of the variations in DSF for each damage state. Using all 20 records might have led to overly complex and cluttered charts that could be challenging to interpret. It can be seen in this figure that when the building frame is slightly damaged, the DSF value is around 0.9. As the damage progresses in the building frame, the DSF value gradually decreases, which indicates that the energy shifts to a higher scale as the damage progresses. With the increasing level of damage state, the wavelet energy decreases at the scale of the first natural frequency of the undamaged frame. It is, therefore, reasonable to claim that the damage at severe intensities of the input ground motion is more likely to occur at DS4. This is due to the fact that, according to the HAZUS–MR5, DS4 is related to complete damage. Another observation is that the variation rate of DSF during the transition from DS2 to DS3 is more significant than that of the preceding damage states (sudden changes in DSF). It may, therefore, be concluded that nonlinear damages progressively initiate in the building frame at the end of DS2.
As already mentioned, the application of rDSF renders more accurate estimates of damage states for high-rise buildings. Hence, the results obtained for the eight- and twelve-story reinforced concrete MRFs were reported in the form of rDSF. To calculate rDSF, the sum of wavelet energies (Escale(a)) at the scales corresponding to the first three natural frequencies were normalized by the sum of wavelet energies (Escale(a)) at scales , 1/3, 1/5, 2, 0.5, and 1/4.5. The values of Escale(a) at scales , 1/3, and 1/5 were found to have the highest wavelet energies among all the scales. Thus, Escale(a) represents the proportion of wavelet energy at these three scales and the shift of the energy to higher scales as the damage progresses. Figures 5(a) and 5(b), respectively, illustrate the variation of rDSF values based on the time-history responses of absolute acceleration for each DS at the roof story of the eight- and twelve-story building frames under 10 ground motions. Analogous to the 4-story building frame, only the first 10 ground motion records were included in Figure 5 to demonstrate the variations in rDSF for each damage state and building frame. It can be seen in Figure 5 that the rDSF values decrease as the damage states increase and, furthermore, the damage at severe intensities of the input ground motion is more likely to occur at DS4. This is due to the fact that, as per HAZUS–MR5, DS4 is related to complete damage. Significant changes in the values of rDSF can be seen with the damage state (DS) progressing from DS2 to DS3.

(a)

(b)
4.2. Correlation between Story Drift Ratio and Damage-Sensitive Features
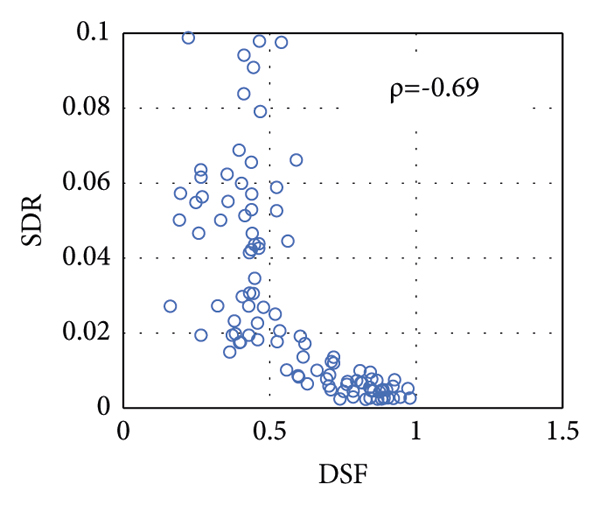
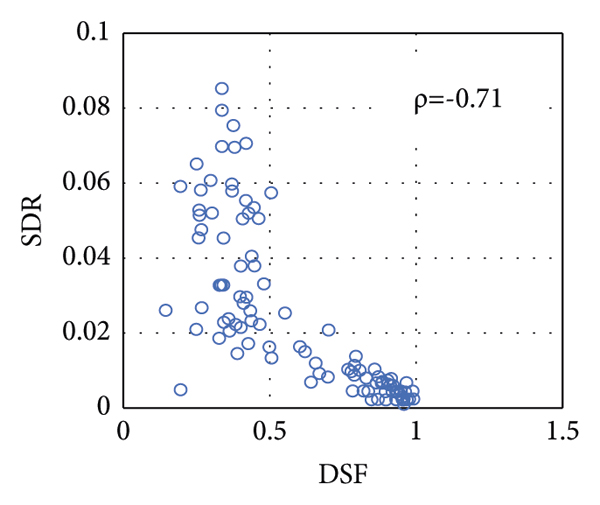
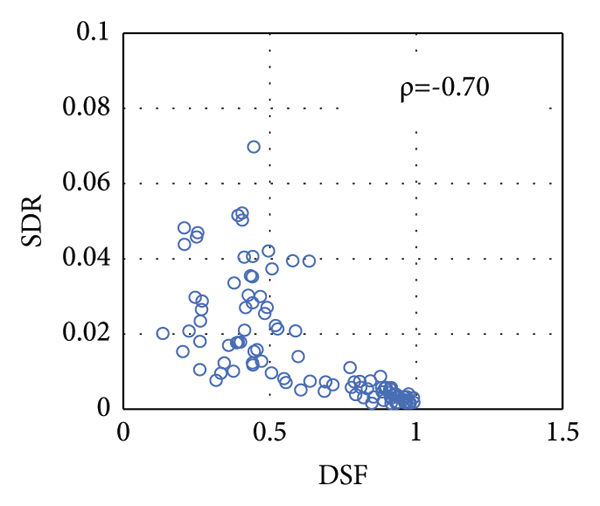
The scatter plots depicting the relationship between DSF and maximum SDR values (DSFi and SDRi) at each story level of the four-story RC-MRF as well as that of wavelet-based DSF and maximum SDR among all the stories are presented in Figure 6. It is worth mentioning that the wavelet-based DSF was extracted from the absolute acceleration responses recorded at each story level and that SDRs were the corresponding maximum interstory drift ratios of the four-story MRF. Furthermore, it is important to note that the first 12 ground motion records with various intensities of scaled earthquakes were utilized in generating the scatter plots in Figure 6, resulting in a total of 102 data points in each plot. Each plot represents data points with increasing damage intensity, encompassing a broader range of seismic responses beyond just the four previously mentioned damage states. The correlation coefficients (ρ) of the pair values for the different stories of the four-story MRF are written inside the different parts of Figure 6. It is seen that the wavelet-based DSFs of the first story to the third story are in good agreement with maximum SDR values, with correlation coefficients established at around 0.7. Furthermore, the lowest correlation coefficient belongs to the last story among all the stories of the four-story MRF, while the best one among all the stories belongs to the pairs of wavelet-based DSF at the roof and maximum SDR.
(a)
(b)
(c)

(d)

(e)
The correlation coefficient of the pair values of wavelet-based DSF and maximum SDRs for all the stories of the eight- and twelve-story MRFs are reported in Tables 6 and 7, respectively. Clearly, there are good correlations established between the values of SDRs and DSF. It can also be deduced from these tables that, compared to the wavelet-based DSF, the rDSF exhibits a better correlation coefficient with SDR. This observation arises from the fact that higher-mode effects with rDSF for high-rise buildings better express the overall behavior of the structures. The reported DSF is, therefore, strongly correlated with SDR and can be used for accurate estimation of the damage state (DS) of the structure.
4.3. Selection of Optimal Intensity Measures
Six different IM candidates widely reported in the literature were examined to identify the optimal IMs for probabilistic estimation of the seismic demand in RC-MRF subjected to various earthquake ground motions. These seismic IMs along with their definitions and units are listed in Table 8.
Table 9 presents comparisons of the different IMs and their corresponding characteristic values for a four-story MRF. As already mentioned, an IM is efficient if its efficiency value (βD|IM) falls in the range of 0.1–0.3. As already mentioned, the values of βD|IM are superior to , leading to the determination of an efficient IM first based on βD|IM, and second based on . Therefore, an IM is efficient if its efficiency value (βD|IM) falls in the range of 0.1–0.3, regardless of how close the value of is to one. However, a higher value of (0 ≤ ≤ 1) confirms the effectiveness of the demand-IM and a lower dispersion among the data. Moreover, a higher value of the regression line (B) reveals the practicality of the selected IM. The absolute value of the parameter ζ expressing the proficiency parameter should be low enough to represent a more proficient IM. The DSF is, therefore, the optimal IM that can be used for the development of accurate fragility functions.
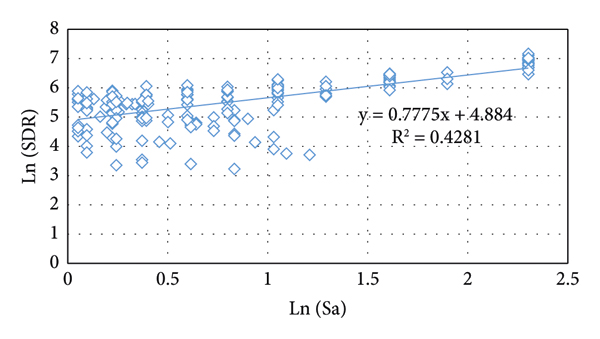
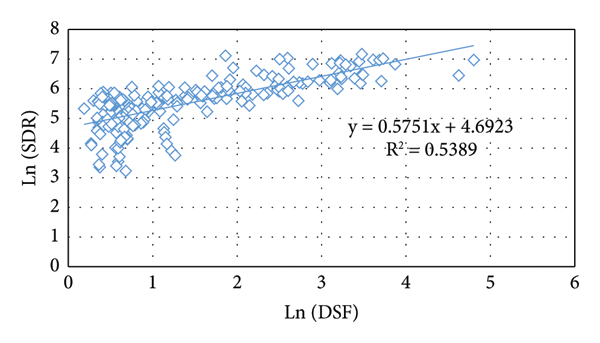
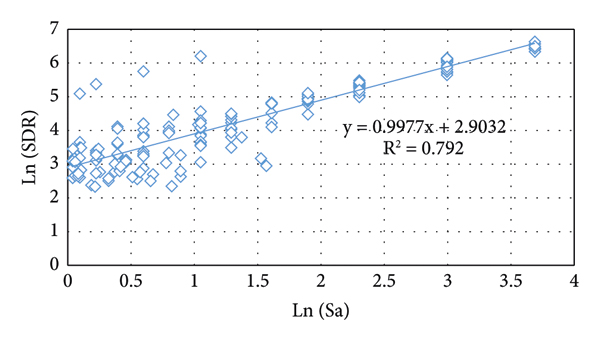
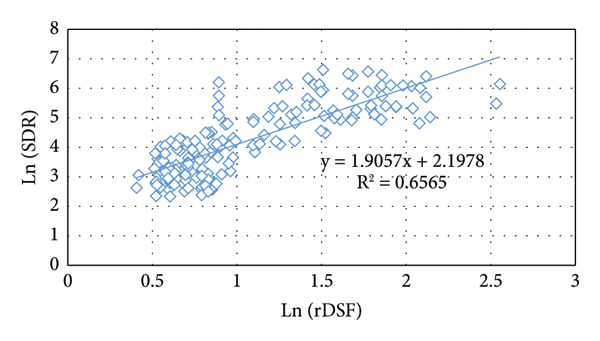
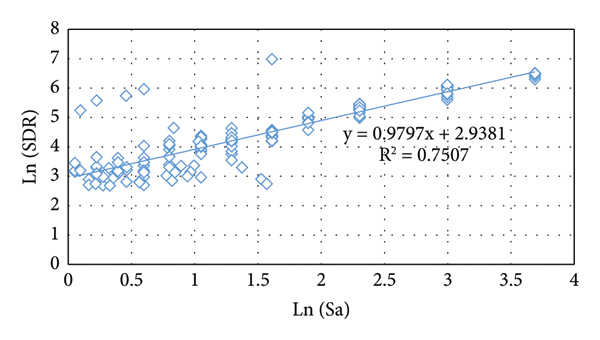
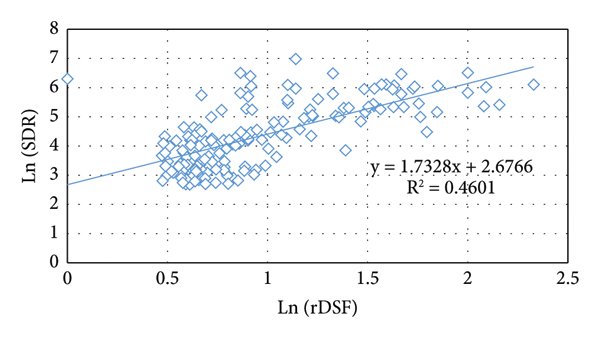
To compare the optimal IM used in the current study and Sa (T1, 2%) as one of the most well-known measures toward estimation of the damage state (DS) of a structure in PBEE, the regression lines of spectral acceleration of the first period (Sa) and the wavelet-based DSF are plotted in Figure 7. For this purpose, the coefficient of determination () was calculated since it can be used to compare how well each of these two measures estimates the SDR. It can be seen in Figure 7 that the wavelet-based DSF has a higher value of than does Sa (T1, 2%). The higher efficiency of the wavelet-based DSF can be attributed to the advantage of the absolute acceleration histories of MRF based on its nonlinear response over that of the traditional Sa (T1, 2%) that is based on the elastic behavior of MRF.
(a)
(b)
It may be inferred from Figure 7 and Table 9 that, compared to the traditional Sa (T1, 2%), the wavelet-based DSF can be exploited toward better estimation of SDR with a smaller variance and lower dispersions, and thus the DSF‐based fragility functions can be more effective in predicting the damage state (DS) of a given structure.
Similar comparisons can be made among the characteristic values of different intensity measures for eight- and twelve-story MRFs. Tables 10 and 11 along with Figures 8 and 9 report the comparisons of different IMs and their corresponding characteristic values for such MRFs, respectively. Analogous to the case of the four-story MRF, the wavelet-based DSF in its refined form (rDSF) is the most satisfactory IM among the selected ones for eight- and twelve-story MRFs. It may, therefore, be concluded that the wavelet-based DSF and rDSF satisfy all the characteristic metrics, as evidenced by the efficiency values (βD|IM) in the range of 0.1–0.3, appropriate coefficients of determination (), high practicality regression line slopes (B), and low proficiency values (ζ). Hence, both the wavelet-based DSF and rDSF can be regarded as optimal IMs for all types of MRFs.
(a)
(b)
(a)
(b)
Table 12 reports the sufficiency values of different IMs for four-, eight- and twelve-story MRFs. It is clear from Table 12 that the wavelet-based DSF and rDSF satisfy the sufficiency requirement for all the different cases. Therefore, the wavelet-based DSF and rDSF were selected as the appropriate IMs from among those considered.
4.4. Development of Fragility Functions with DSF and rDSF
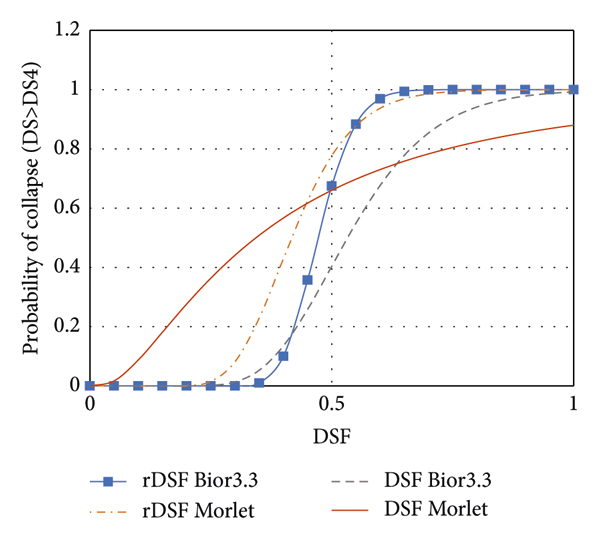
The procedure employs the roof absolute acceleration to determine the wavelet-based DSF and rDSF. The findings of the current study showed that both the wavelet-based DSF and rDSF were the optimal IMs among the selected intensity measures to map the fragility curves. Therefore, the fragility curves obtained from the roof’s absolute acceleration response can be accurately employed to evaluate the severity of the structural damage. The two mother wavelet families of Morlet and Bior3.3 were used in this study for a comprehensive evaluation of the incidence probability of a specific damage state (DS) versus the wavelet-based DSF and rDSF. As already mentioned, the present authors have shown that the Bior3.3 wavelet family is superior to all other wavelet families in terms of SHM of reinforced concrete MRFs and that they render more accurate damage estimates.
Figure 10 compares the fragility curves for the four-story MRFs depicted with Morlet and Bior3.3. Furthermore, the probability distribution parameters of the Morlet and Bior3.3 curves are listed in Table 13. It is understood from Figure 10 and Table 13 that the fragility curves estimated by the Bior3.3 wavelet-based DSF exhibit better performance and higher efficiency than those derived from the Morlet wavelet-based DSF. This observation stems from the lower median and standard deviation values of fragility curves depicted by the Bior3.3 wavelet family. While the median itself does not directly indicate the performance of the fragility curves estimated by the Bior3.3 wavelet-based DSF, it serves as a robust measure of central tendency in the dataset. In the context of fragility curves, a lower median value can suggest a more conservative estimate of structural vulnerability at a given intensity level. On the other hand, the standard deviation quantifies the spread or variability of data points around the mean or median. A lower standard deviation indicates that the data points are closer to the average value, implying less variability and greater consistency in the results. In the case of fragility analysis, a lower standard deviation can signify more reliable and representative estimates of structural response to seismic actions. When considering both the median and standard deviation values together, a fragility curve with a lower median and standard deviation can be interpreted as having more consistent and precise estimates of structural vulnerability across different intensity levels. The combination of a lower median (indicating central tendency) and a lower standard deviation (indicating reduced variability) supports the conclusion that the fragility curves based on the Bior3.3 wavelet offer more reliable and accurate assessments of structural fragility compared to those derived from the Morlet wavelet. In other words, the lower median and standard deviation values imply that the fragility curves developed using the Bior3.3 wavelet are more robust and less prone to variability or outliers, thereby improving the accuracy and precision of the analysis.

(a)

(b)

(c)

(d)
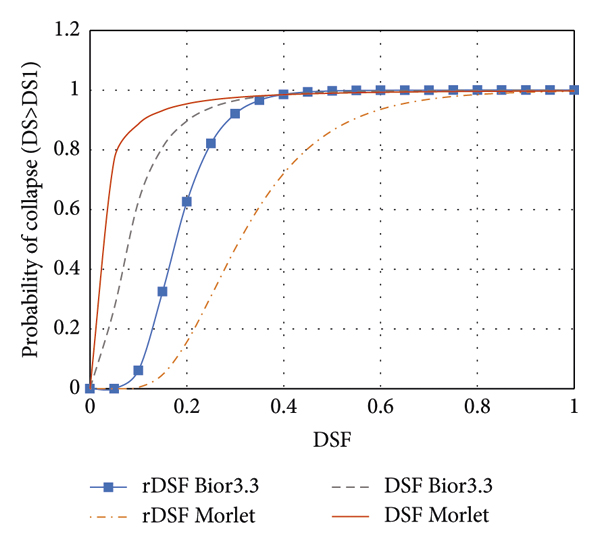
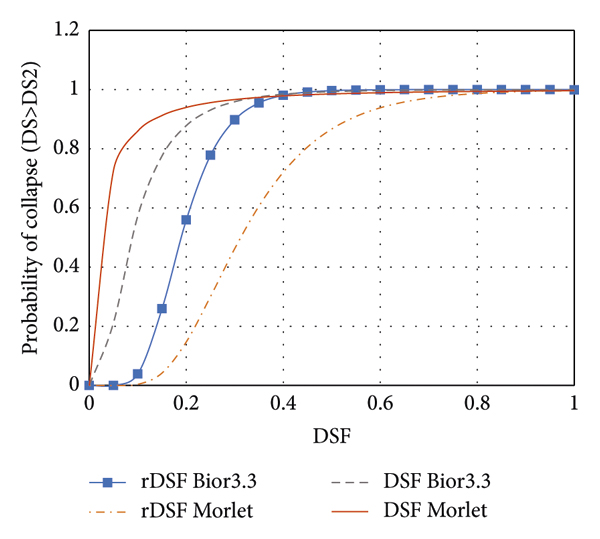
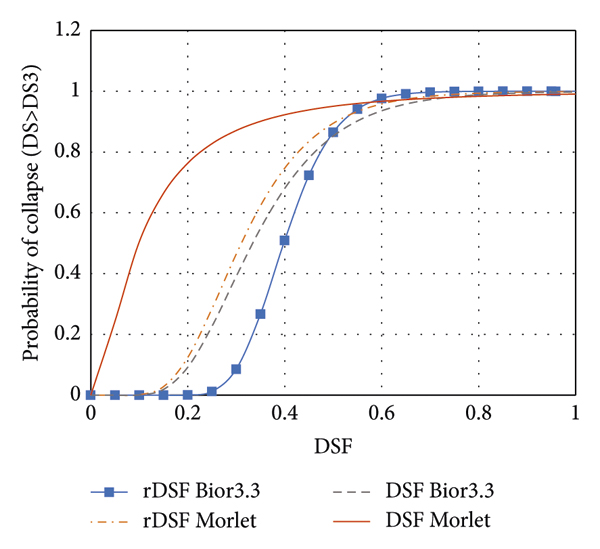
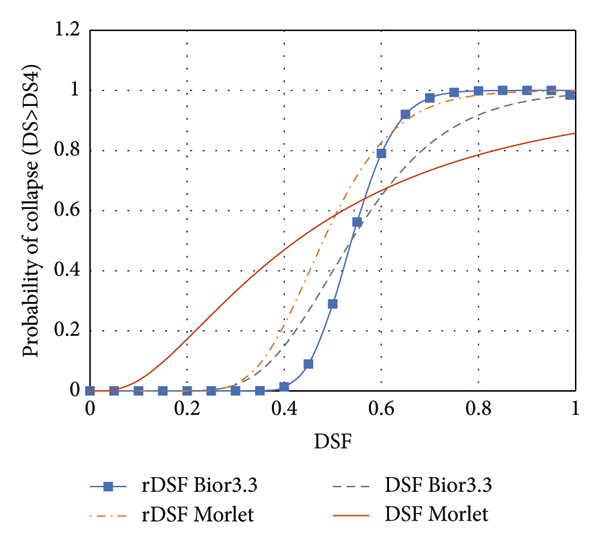
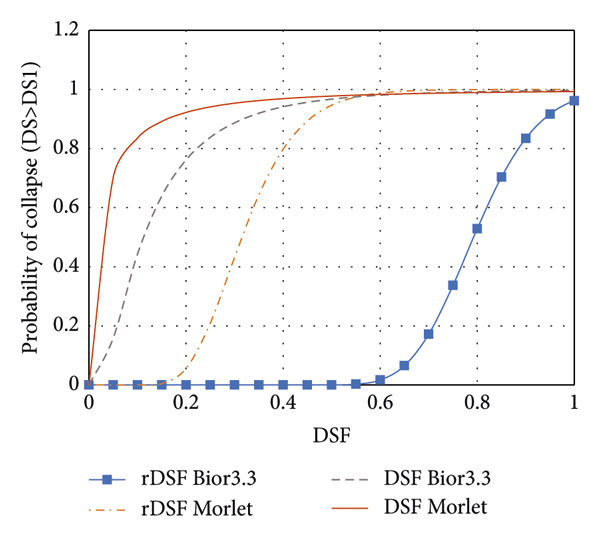
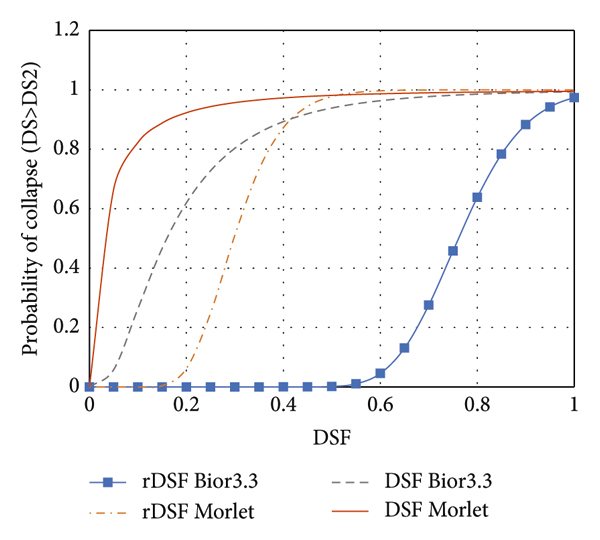
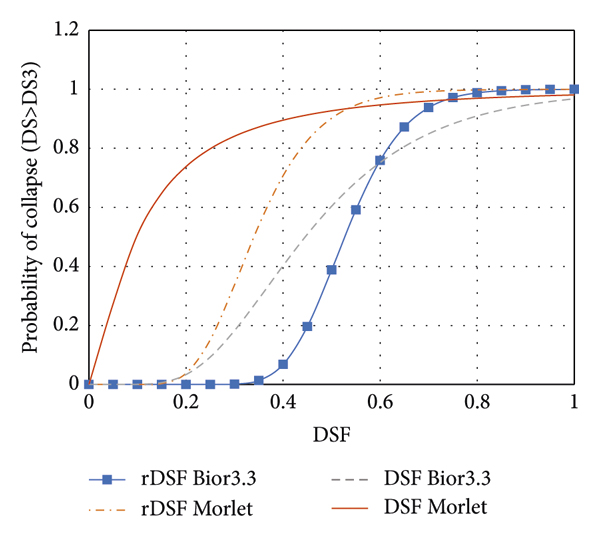
The fragility curves generated using wavelet-based rDSF for high-rise buildings of eight- and twelve-story frames take into account the effects of higher-mode contributions and show a lower probability of damage than those derived from wavelet-based DSF that consider only the effect of the first mode period. Therefore, the fragility curves derived from wavelets-based rDSF are more capable of revealing building performance. This superiority might be due to the better correlation established between rDSF, rather than conventional DSF, and maximum SDRs of high-rise buildings. The fragility curves for eight- and twelve-story frames are presented in Figures 11 and 12 and the parameters of their probability distribution functions are reported in Tables 14 and 15. It is clearly seen that the fragility curves obtained via Bior3.3 wavelet-based rDSF exhibit better performance and higher efficiency than those derived from the Morlet wavelet-based DSF and rDSF. Due to the lower median and standard deviation values, the fragility curves depicted by the Bior3.3 wavelet family are more robust and less susceptible to variations, ultimately leading to more accurate solutions.
(a)
(b)
(c)
(d)
(a)
(b)
(c)
(d)
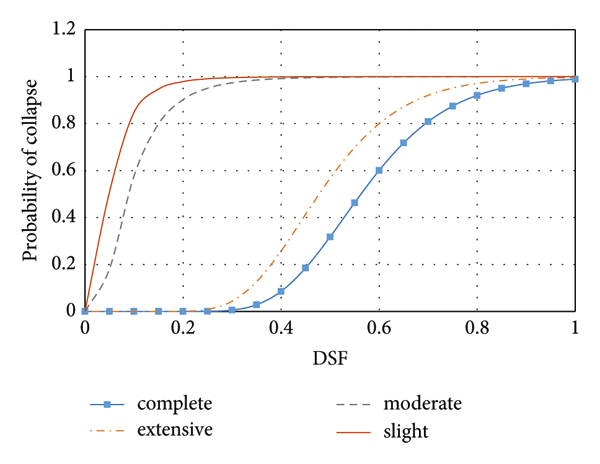
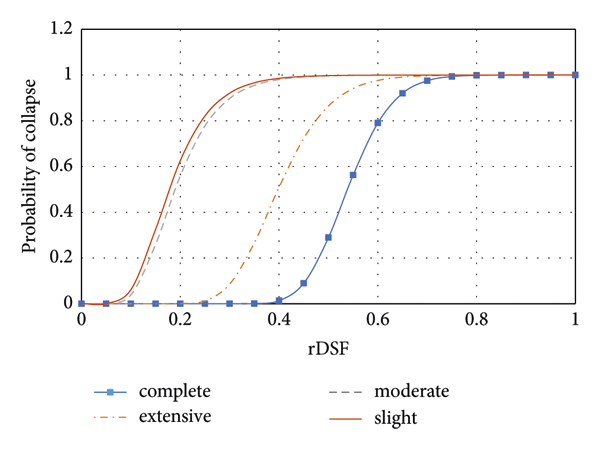
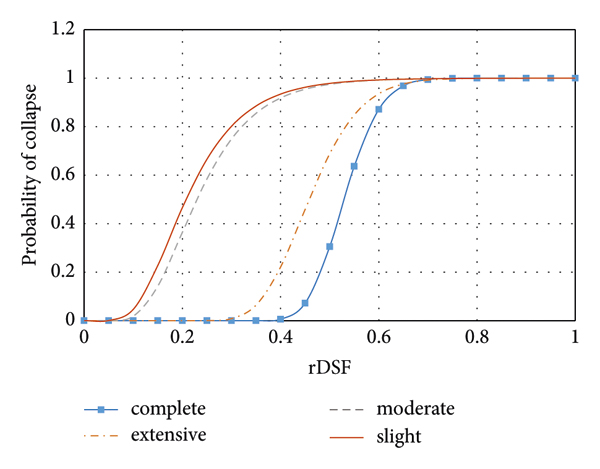
Figure 13 shows incidence probabilities for different damage states versus the wavelet-based DSF and rDSF drawn by the Bior3.3 wavelet family at the roof level of the four-, eight-, and twelve-story building frames studied. Evidently, the probability of slight damage is higher than any others at specific values of wavelet-based DSF and rDSF.
(a)
(b)
(c)
5. Summary and Conclusions
In this study, a framework was introduced for the development of fragility functions of reinforced concrete MRFs subjected to different earthquake ground motions based on the wavelet-based DSF and rDSF. To map the conditional probability of being in, or exceeding different damage states, the structural responses of the building frames were examined against selected threshold values of damage states.
Three different concrete MRFs of four, eight, and twelve stories were selected to develop their fragility curves. Furthermore, two different wavelet-based damage-sensitive features, namely, DSF and rDSF, were extracted from the absolute acceleration responses of concrete MRFs using the Bior3.3 and Morlet mother wavelet transform functions. As the accuracy of seismic assessment and certainty in predicting structural performance strongly depend on the optimal intensity measure (IM) selected, the reliability of the wavelet-based damage-sensitive features and some other intensity measures were examined against the statistical metrics of efficiency, practicality, proficiency, coefficient of determination, and sufficiency. The optimal IM was then implemented to draw the relevant fragility curves. The following conclusions may be drawn from the comparisons of the different outcomes observed:(i)DSF and rDSF values gradually decline as damage progresses in building frames; this indicates how energy shifts to higher scales.(ii)With rising damage state levels, the wavelet energy diminishes at the scale of the first natural frequency of the undamaged frame and the damage pertinent to severe intensities of the input ground motion is more likely to occur at DS4. This is justified by the fact that DS4 is related to complete damage as defined in HAZUS–MR5.(iii)The impressive variation rate and sudden changes in DSF and rDSF from DS2 to DS3 can be attributed to the initiation of progressive nonlinear damages at the end of DS2.(iv)The wavelet-based damage-sensitive features (DSF/rDSF) are found to satisfy all the statistical criteria. DSF/rDSF was found to be the optimal IMs among the selected ones. This is evidenced by an efficiency value (βD|IM) recorded in the range of 0.1–0.3, a high value of the coefficient of determination (), and a high value of the regression line (B) revealing their practicality as well as a low value of ζ expressing their proficiency.(v)The correlation coefficients of the pair values of wavelet-based DSF and maximum SDRs’ values confirm their consistency. For low-rise buildings, the values obtained from the conventional DSF are in good agreement with maximum SDRs. For high-rise buildings, however, rDSF shows a better correlation when compared with the conventional DSF.(vi)In the case of high-rise buildings with eight- and twelve-story frames, the fragility curves derived from the wavelet-based rDSF that takes the effect of higher-mode contributions into account show a lower probability of damage than do those of wavelet-based DSF that take into account only the effect of the first mode period. The fragility curves derived from the wavelet-based rDSF are, therefore, better capable of revealing structural behavior. This is attributed to the better correlation between rDSF, rather than the conventional DSF, and maximum SDRs of high-rise buildings.(vii)The results of the current study demonstrate the superior performance and efficiency of fragility curves derived via the Bior3.3 wavelet-based DSF/rDSF than those derived via the Morlet wavelet-based DSF/rDSF.
Data Availability
All the data, models, or codes that support the findings of this paper are available from the corresponding author upon reasonable request.
Conflicts of Interest
The authors declare that they have no conflicts of interest.
Authors’ Contributions
All persons who meet authorship criteria are listed as authors, and all authors certify that they have participated sufficiently in the work to take public responsibility for the content, including participation in the material preparation, data collection, conceptualization, design, analysis, writing the first draft, and revision of the manuscript. Minoo Panahi Boroujeni conceptualised the study, developed the methodology and the software, performed the formal analysis, validated and investigated the study, curated the data, visualized the study, wrote the original draft, and wrote, reviewed, and edited the study. Seyed Alireza Zareei, Mohammad Sadegh Birzhandi, and Mohammad Mahdi Zafarani conceptualised the study, developed the methodology, curated the data, wrote the original draft, supervised the study, administered the project, and wrote, reviewed, and edited the study.
Acknowledgments
The authors would like to express their gratitude to the Pacific Earthquake Engineering Research Center for providing access to the PEER data ground motion database.