Abstract
Taking the deep mined-out areas of Paishanlou Gold Mine as the research object, we designed the indoor similar physical model test and used VIC-3D and resistance pressure sensors to record the vertical stress and strain of the model during the test. And based on the results of digital image correlation (DIC) analysis, we deeply analyzed the deformation and failure characteristics of the surrounding rock in the process of goaf caving. At the same time, the failure mechanism of surrounding rock mass and the law of temporal and spatial evolution during the excavation process of pillars between the mined-out areas were studied. According to the characteristics of the caving process, it can be divided into three stages: initial caving in a small range at the arch angle, continuous vault collapse, and instantaneous huge caving of the roof. Before the occurrence of instantaneous large caving at the top, the phenomenon of sudden increase of caving arch curvature appears. Based on the monitoring results, it can also be seen that the deformation of overlying rock mass is most affected by the span of the cavity, and the vertical strain is inversely proportional to the depth. The rock mass stress and strain caused by the excavation of isolation pillars between adjacent two goafs have an obvious time delay phenomenon. The time delay effect of the strain is proportional to the span of the cavity; conversely, it is inversely proportional to the span of the cavity. Specifically, throughout the experiment, the subsidence of the target area of the test model is larger in the middle and smaller on both sides; simultaneously, the upper part is high, and the lower part is low. However, the variation of the stress value shows the characteristics of higher on both sides and lower on the middle area and higher on the upper part and lower on the lower part. To sum up, the experimental results show that the caving process can be predicted and effectively controlled manually, and a new treatment method can be provided for the control and prevention of the large caving and mining subsidence damage in the goaf combined with the field monitoring method.
1. Introduction
Over the years, the induced caving method has gradually been applied to the treatment of the goaf. It does not have bottom structure and does not have strict requirements for the caving time and lumpiness. Because it is essentially different from the natural caving method in terms of technology, it can be considered as a natural caving method improved in the form of undercutting and the structure of the ore extraction. For this reason, it is called the induced caving method [1–5]. The main process is to apply disturbances to expand the effective exposure area of the mined-out area artificially (including elimination of supporting pillars, undercutting, precracking, and other auxiliary works) in specific rock mass projects, providing internal stress concentration effects in the orebody and rock mass, and inducing the deformation and caving of the roof. The main difficulty lies in the fact that the support of the pillars has accumulated caving energy in the roof of the goaf to be caved, and the concentrated release of the energy will lead to the instantaneous collapse of the roof surrounding rock, endangering the safety of the mine. Therefore, it is necessary to use advanced theory of induced rock breaking to artificially intervene the caving process, so that the roof surrounding rock can complete the caving process in the form of sporadic caving [2, 5, 6].
At present, the main methods for studying the caving of orebody and rock mass include similar material simulation experiment, numerical simulation analysis, theoretical analysis, and on-site monitoring [7–13]. The simulation of surrounding rock stress and deformation is the key to the development or improvement of new treatment methods for goafs, and similarity physical model test is one of the typical research methods. It can reverse the relationship between the physical quantities obtained during the test to the simulated prototype, thereby directly reflecting the corresponding deformation and failure characteristics and evolution process of the actual engineering object. It has the characteristics of easy operation, low cost, and high simulation. Besides, it can also carry out some research that cannot be realized in actual engineering, so it has been widely used in recent years [11, 13, 14]. He et al. [9] established a support-surrounding rock mechanical model considering the behavior of an elastic cantilever beam in order to study the hard roof fracturing characteristics and mining-induced stress behaviors. Ren et al. [11] designed physical simulation experiments to analyze the deformation and failure characteristics of the surface and surrounding rock around the goaf, as well as the creep behavior and failure mechanism of surrounding rock deformation. Wang et al. [15] and Chen et al. [16] conducted physical and numerical simulation of field monitoring for the movement and structure of the overlaying strata on the fully mechanized top-coal caving face. But nowadays, most of the similar material model experiments can only qualitatively reflect the caving phenomena, which can only be used as a reference for analysis of rock caving process. Even if some monitoring equipment is introduced, due to the lack of accuracy and simplicity of test method, there is still a lack of in-depth study on the caving process of multi-mined-out areas and the law of temporal and spatial evolution of the three-dimensional morphology of caving arches. These years, the development of computer analysis software, sensors, and imaging technology makes it possible to obtain the temporal and spatial evolution rules of caving process, caving arch, and cracks during the test. In addition, the introduction of on-site drilling monitoring equipment has further optimized the goaf management scheme [12, 17, 18].
This paper takes the treatment of multi-mined-out areas of Paishanlou Gold Mine as the research background, based on similarity theory, and uses VIC-3D (noncontact full-field strain measurement system) and resistive pressure sensor as measurement tools to design a similar physical model simulation test. Through the test, we studied the caving mechanism of the roof surrounding rock during the excavation of the pillars in the deep mined-out areas and the process of simulated undercutting and explored the internal law of the induced caving process. Combining the experimental research results with the RG underground TV monitoring technology, we can effectively control the caving process of the goafs, so as to safely deal with the goaf while recovering the residual ore and convert the overstocked ore in goafs into available resources.
2. Geological Conditions of the Experimental Prototype
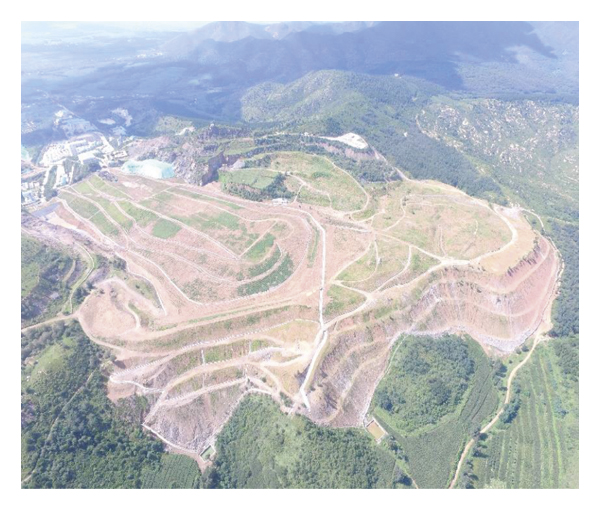
Paishanlou gold deposit belongs to a large metamorphosed hydrothermal gold deposit in the same ductile shear zone. The surrounding rocks of near-orebody are mylonite, and the surrounding rocks far away from the orebody are primary mylonite and mylonitized rocks. The orebody thickness of Paishanlou Gold Mine is medium to thick, the dip angle is generally 35°∼55°, the stability of roof surrounding rock is good, and the ore grade is low. Due to the large thickness of the orebody and the slow attitude and concentrated distribution of orebody, the open-pit mining method is used in the upper orebody. After mining to the level of +300 m, it is transferred to underground mining, and the open-pit method is used in the process of transferring from open-pit to underground. And then the whole upper mined-out areas are induced to penetrate the surface, and the subsidence area is filled from the surface and reclaimed land (see Figure 1). Because it is located in a scenic protection area, the surface is not allowed to collapse (see Figure 1(c)). Based on the treatment experience of the upper goaf, the safe and efficient mining technology of zoned open stope with subsequent filling was developed.

(a)
(b)

(c)
(d)
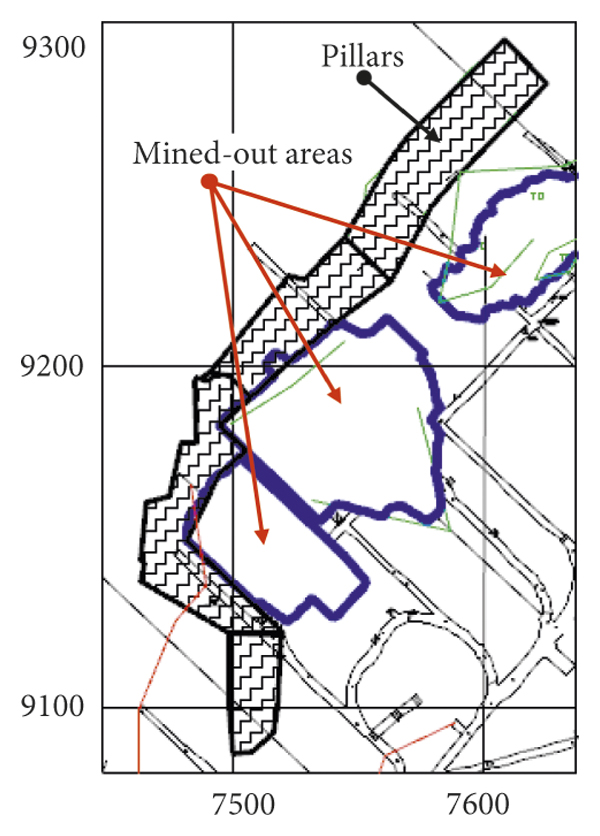
Based on the field geological survey and the classification of rock mass stability, the mechanical parameters of rock mass in Paishanlou Gold Mine are obtained (see Table 1). The stability level of surrounding rock in each level of Paishanlou Gold Mine belongs to medium stable∼stable. The borehole monitoring shows that the current height of the mined-out area from the ground surface is 245∼410 m, and the goaf is already in a caving state, and the current caving height of the mined-out area is about 13∼70 m, so it is urgent to deal with the mined-out areas at present.
In this paper, we took the deep mined-out areas of Paishanlou Gold Mine as the experimental prototype, simulated the process of cutting through between multi-mined-out areas and rock strata induced caving, and studied the rock mass failure mechanism and caving law in the process of penetration and caving of multi-mined-out areas. The simulated range of the test was roughly from level of +225 m to level of +125 m, with a dip length of about 240 m. This design scheme adopts the induced caving method; that is, the pillars between the goafs are excavated first, and then the undercutting project is arranged in the rock mass at the bottom of the goaf to induce the natural caving of the upper orebody.
3. Description of the Similar Physical Model Simulation Test
3.1. Test Equipment
3.1.1. Similar Physical Model Simulation Test Bench
The main equipment for this test is an electrohydraulic servo multichannel similar material test bench (see Figure 2(a)). It is a plane loading system that adopts active loading mode. The equipment adopts multichannel independent control technology that simulates distributed loads. It can simulate the excavation process in mining and geotechnical engineering indoors. Multichannel independent control technology can simulate distributed loads. The upper part of the test bench is equipped with 7 vertical oil cylinders, that is, 7 channels. Each channel can be individually controlled and nonlinearly loaded. Each channel can load a maximum of 150 kN test force, and the actual control accuracy is 0.5 kN. The three oil cylinders of the test bench are combined into one channel, and the maximum load is 600 kN. The test bench can realize the constant rate loading of the test force, can carry out the experiment under the constant load within a given accuracy range, and can ensure the long-term stability of the axial and horizontal load during the experiment.

(a)

(b)

(c)
3.1.2. Equipment and Principle of Strain Measuring
Because the surface displacement meter has a large direct measurement error and is not easy to install, we use a noncontact full-field displacement measurement system (VIC-3D for short) (see Figure 2(b)) to monitor the displacement change of the model surface. The DIC (Digital Image Correlation) used by VIC-3D is a simple optical measurement method to measure surface deformation of objects. DIC technology can be used in general indoor and outdoor environments, and the strain measurement range is from 0.005% (50 microstrains) to 2000%. The size of the measuring object can be from 0.8 mm to tens of meters. In principle, strain can be measured as long as the image can be obtained. It mainly adopts the method of spraying speckle on the surface of the model, combined with industrial close-up photography technology, with real-time acquisition of digital images of the region of interest (speckle pattern) in each deformation stage of the object. DIC tracks the smaller areas with gray value patterns during the deformation process, which we call the subset subarea. Find the relevant area of the image by grayscale and calculate the strain on the surface of the object by using an algorithm similar to that used in finite element analysis software to obtain the surface displacement and strain distribution [17]. Then the displacement field data is smoothed, and the corresponding deformation information is visualized to realize fast, high-precision, real-time, noncontact, full-field deformation and strain measurement (see Figure 3).

After the simulation experiment, photos are analyzed in order to obtain the deformation and strain. The strain calculation in VIC-3D can be briefly summarized as follows (see Figure 3).
The strain calculation in Vic-3D is similar to the algorithm generally used by FEA software. The input for the strain calculation is the grid of data points from the correlation—a cloud of X, Y, Z points and U, V, W displacement vectors (see Figure 3A).
The separation between these points (in pixels) is dictated by the step size. The separation between the points in physical space will vary depending on magnification and the shape of the specimen. With this grid as the input, we consider each point separately and create a local mesh of triangles; here, we consider the highlighted point from above (see Figure 3B).
Next, we consider the deformation of each triangle separately (see Figure 3C).
Rigid body motion is easy to remove at this point (see Figure 3D).
The remaining deformation of the triangle gives us exactly enough data to compute a single, constant strain tensor for this triangle. We repeat this for each triangle (see Figure 3E).
Since we want a strain for each existing data point, we interpolate from the surrounding strains (see Figure 3F).
We repeat this process for each point until we have a strain tensor at each initial data point (see Figure 3G).
Because the local triangles are small, the directly calculated strain tensors can be noisy, so at this point we smooth over a group of points. The size of this smoothing group is dictated by the user (“filter size”) and is a Gaussian (center-weighted) filter (see Figure 3H). The region of interest in the model is composed of these smoothed points, forming the final strain cloud image.
3.1.3. Equipment and Principle of Stress Measuring
For the measurement of the internal pressure of the model, we adopted the resistance strain sensor (see Figure 2(c)), whose resistance strain gage has the strain effect of metal; that is, mechanical deformation is generated under the action of external force, so that the resistance value changes accordingly. According to the principle of resistance strain effect, the deformation of the measured object is transformed into the change of the resistance parameter of the sensitive element, which is transformed into the output of voltage or current signal by the circuit, so as to realize the measurement of nonelectric quantity such as pressure.
3.2. Mechanical Parameters of the Strata and Determination of Similar Model Material Ratios
The principle of the simulation experiment of similar materials is to use materials with similar mechanical properties to the mine prototype. Based on the three theorems of the similarity theory, the model is made according to the geometric similarity constant and the specific engineering conditions on-site, and the similar physical model is used to simulate all kinds of mine engineering. Then the phenomenon and data obtained can be used to speculate and analyze the rock mass change law in the mine prototype, so as to improve the production process.
The geometric shape of the model is similar to the engineering entity and satisfies the length ratio as a constant, that is,where aL is geometric similarity ratio; Lp is entity size; Lm is model size.
According to the mine geological data, in the induced caving mining scheme, it is necessary to focus on the caving law of the roof surrounding rock at a height of about 100 m. Considering the size of the experimental equipment, the geometric similarity constant is selected as 100.
According to the data provided by the mine, the bulk density of mylonite ore is taken as γm = 2.74 t/m3, and the bulk density of marble is taken as γn = 2.62 t/m3. According to the proportioning experiment, the bulk density of similar materials with different proportions is close, which is γs = 1.70 t/m3. Therefore, the ore rock bulk density similarity constant is
The stress similarity constant is calculated by the similarity theorem, aσ = aγaL = 150, after calculation, aσ = 150. At the same time, the elastic model similarity constant aE = aσ = aγaL = 150 can also be calculated. Take the time similarity constant as
According to on-site investigation, the surrounding area of the project can be regarded as a homogeneous gravitational field. The vertical ground stress of the target orebody at +175 m is σp = 10.508 MPa. After calculation, the vertical loading stress of the model is
This paper simplifies the structural characteristics of the mine prototype, only simulating the horizontal layered rock mass structure, and aims to find the mechanism and basic laws of rock mass caving and then gradually simulates rock mass caving under complex conditions in subsequent studies. According to similar theory, the boundary conditions of the model should be as consistent as possible with the prototype. The first mining level in the mine prototype has sufficient width and length. For homogeneous rock mass, the range of stress redistribution caused by excavation is approximately equal to 3 to 5 times the excavation space. Therefore, when using the applied load method to study the problem, the simulation range should be at least 3 times larger than the excavation space. The excavation height of this simulation experiment is 0.1 m, so the model size is at least height × length = 0.5 × 0.5 m. According to the loading space size of the electrohydraulic servo multichannel similar material experimental platform, the size of the model produced this time is designed to be length × thickness × height = 2400 mm × 200 mm × 100 mm, and the model size can meet the requirements of similar theories [11].
3.3. Determination of Similar Physical Model Material Ratios
“Similar physical model material ratio” refers to the proportion of various materials contained in the model stacked on the test bench. In order to find the appropriate ratio of similar physical model materials, we mainly studied the influence of sand-to-rubber ratio, gypsum-cement ratio, water content, and rosin alcohol solution content on the strength of similar materials. Firstly, according to the experience of similar mines, 11 sets of material proportioning schemes were screened out through orthogonal experiment. Each set of proportioning schemes produced 5 compressive test pieces and 5 tensile test pieces. The test specimens produced in the compressive strength experiment are ϕ50 × 100 mm. The tensile strength test specimen is a test piece of ϕ 50 × 50 mm (see Figure 4(c)). Regression orthogonal experiment method is used to carry out rock strength test on samples with different proportions. The compressive strength can be obtained by using an extensometer to test the deformation of the specimen (see Figure 4(a)), and the tensile strength can be measured by the Brazilian split test (see Figure 4(b)), taking uniaxial compressive strength, tensile strength, elastic modulus, and Poisson’s ratio as the control targets for the strength of similar materials, and summarizing the regression equation for simulating the ratio of similar materials, so as to obtain the simulation material that satisfies the similar physical simulation test. The mechanical properties require the optimal proportioning scheme [7] (see Table 2).

(a)

(b)

(c)

(d)
3.4. Establishment of the Similarity Model
3.4.1. Test Model Design
The electrohydraulic servo multichannel similar material test bench can simulate the excavation process in mining and geotechnical engineering indoors. The equipment adopts active loading mode to simulate the excavation process under deep conditions. The equipment adopts multichannel independent control technology, which can simulate distributed load. The 7 axial loading cylinders are independently controlled, and the 3 horizontal loading cylinders are controlled synchronously. The loading force of the test can be loaded at a constant rate, and the test under constant load can be carried out within a given accuracy range. The long-term stability of axial load and horizontal load can be ensured during the test.
The size of the test model is length × thickness × height = 2400 mm × 200 mm × 1000 mm. The model is stacked in layers, and the upper part of the wood is used for layered compaction. The lowermost part is 200 mm high as the excavation space, and a preburied layer of extractable bricks is used for the test block (length × thickness × height = 200 mm × 50 mm × 100 mm). In the test, the wood blocks are removed one by one to simulate the excavation process of the orebody. At this moment, we observe the development of roof cracks in the excavation space and the caving of the upper mined-out areas (see Figure 5(a)) below. After 3 days of stacking the model, three holes of different sizes are drilled at predefined positions in the model according to the similarity ratio. After stacking the model for 7 days, speckles are sprayed on the position shown in the figure (as shown in Figure 5(b)); then we can carry out the loading and excavation tests.

(a)

(b)
3.4.2. Procedure of the Model Test
The purpose of this test is to study the failure mechanism and caving law of rock mass in the process of induced caving in the deep multi-mined-out areas of Paishanlou Gold Mine. K1, K2, and K3 represent three mined-out areas, respectively, and the process of excavation is mainly divided into four steps. A total of 9 resistive stress sensors are arranged inside the model, which are, respectively, buried at points A, B, D, E, F, G, H, I, and J to monitor the trend of stress changes during the entire experiment.
In the test, we apply uniform pressure to the model according to the magnitude of the crustal stress, and the vertical load of 10 kN is applied to the 7 channels of the model before the model is excavated; then we keep the load constant. After about 10 minutes, we start to excavate No. 1 (between K1 and K2) and No. 2 pillars (between K2 and K3) in turn. After the excavation of each pillar, a period of time should be set aside to wait for the model to stabilize. Then we begin to continuously remove wood blocks from the bottom starting point which is 700 mm to left side of the model to simulate the caving of the surrounding rock on the roof. In this process, in addition to the VIC-3D monitoring test process, another high-definition camera is also needed to record the formation of fracture line and rock caving process of similar physical models (see Figure 6).

4. Results and Discussion
4.1. Deformation and Failure Characteristics of Rock Mass
4.1.1. The Process of Deformation and Failure
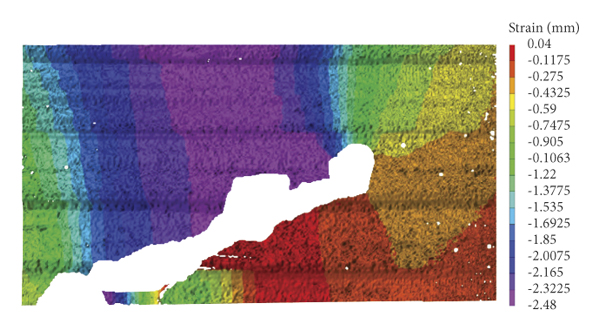
Firstly, the vertical load is increased from 35 kN (load after the initialization of loading equipment) to 70 kN. Throughout the process of the test, the vertical load is kept constant without active horizontal loading. The model failure process is shown in Figure 7. When the model load is stable, it is found from the vertical strain cloud diagram (Figure 8(a)) that the overall displacement of the model gradually decreases with the increase in depth, and the greater the span of the empty area, the greater the vertical displacement above it. At this time, the centerline of the settlement zone is close to goaf K3 with a larger span. From Figures 8(b) and 8(c), we know that when the pillar No. 1 between the goafs K1 and K2 (all the following texts will be referred to as “pillar No. 1”) is excavated, a 30∼55 cm thick cone-shaped subsidence zone is quickly formed above the goaf after penetration, and the larger the goaf span, the more the vertical subsidence. The average displacement at this time is 0.4 mm, but after about 200 s, the subsidence zone gradually shifts to the top of the pillar 1 and then continually spreads to left of the upper of the model (the region is above K3) to the top of the model, and the average displacement increases to 0.5 mm. Then we excavate the No. 2 pillar between K2 and K3 (all the following texts will be referred to as “pillar No. 2”) (see Figures 8(d) and 8(e)). The displacement above No. 2 pillar increased rapidly. Meanwhile, a 30 cm deep butterfly-shaped subsidence zone is formed in the middle of the model with an average deformation of 0.7 mm. After about 5 minutes, the large deformation area gradually evolves into a chimney shape, and the average amount of deformation increased to 1 mm. At this very moment, two strip-shaped deformation areas that spread to the top of the model were formed above the goafs K1 and K2, and the average amount of deformation was 0.85 mm. After that, the third step of the simulated undercutting project is carried out. After the excavation of the left corner of K3, the chimney-shaped deformation zone gradually expands, and the gourd-shaped deformation zone appears in the central area. The displacement of the central area was 1.3 mm, and the displacement of the upper part of K3 was 1 mm (see Figures 8(f) and 8(g)); simultaneously, a 53° crack appears above K3 (see Figure 7(e)). With the excavation in the fourth step, the deformation area gradually develops into a rectangle with a displacement of 2.48 mm, followed by a caving, which is now in the sporadic caving stage. After a strip-shaped deformation zone with an average deformation of 4.3 mm appeared again in the lower left of the rectangular displacement zone, a fracture line of 59° appeared in the left side of the roof (Figure 7(f)), and then a continuous caving occurs. After the continuous caving, the remaining roof maintained a stable period of about 3 minutes, and then large cracks of 71° and 58° penetrating to the top were formed on the left and right sides of the model, and then a large caving occurs rapidly until the model collapses (see Figures 7(g) and 7(h)).

(a)

(b)

(c)

(d)

(e)

(f)

(g)

(h)

(a)

(b)

(c)

(d)

(e)

(f)
(g)

(h)

(i)
4.1.2. Analyses of Deformation and Failure Mechanisms
According to the analysis of the similar test process, the entire destruction process of the goafs can be divided into five stages, namely, the deformation and failure of rock mass, the instability stage of sporadic caving, the continuous caving stage of separation layer of roof, and the instantaneous huge caving stage of the roof. The rock mass of original goafs is in a state of squeezing, and the mining of the pillar will unload the surrounding pressure, and the goaf that loses its original support will cause the redistribution of the surrounding rock stress.①After the No. 1 pillar is excavated (the mined-out area after the penetration of K1 and K2 is called K12), the roof of the mined-out areas under the action of gravity of the overlying rock mass will bend to the free surface (see Figure 8(b)). After the spontaneous stress redistribution process of the surrounding rock, a stable deformation zone “a” is formed in the upper area of the goaf K12, and the average deformation is the largest (Figure 8(c)). Similarly, when the No. 2 pillar is excavated, the main deformation zone gradually shifts from the upper area of K12 to the position of the No. 2 pillar, and finally the deformation zone “b” is formed (Figure 8(e)). The two steps have undergone the process of elastic deformation-plastic deformation, and the transition from elastic deformation to plastic deformation is due to the redistribution of stress around the goaf caused by the excavation of the pillar. According to the analysis of the cloud diagram, the pressure properties of the roof of the goafs in the deformation zone “a” are mainly compressed, and the exposed area of the roof expanded with the excavation of the pillar, which makes the stress properties of the roof of the goaf transform from the compressed state to tension state. As known from the foregoing, the ore rock in the goaf is medium-hard rock with poor ductility, so the main form of ore rock failure is brittle failure. From the perspective of failure mechanism, it can be divided into two categories: tensile failure and shear failure. With the progress of the simulated undercutting project, the span of the mined-out area has further increased, the tensile stress of the surrounding rock of the roof exceeds the allowable tensile strength of the rock mass, and the left lower foot of model begins to show 53° crack failure line under the action of shear stress (as shown in Figure 7(e)).②With the progress of the undercutting project, the stress concentration phenomenon at the undercutting position makes the crack failure further expand upward. Caving occurs when the surrounding rock stress is not enough to support the self-weight of the rock formation, and the caving rock lumpiness is small, and we call this stage sporadic caving.③The undercutting project destroys the stress balance of the surrounding rock. With the progress of sporadic caving, the fracture damage gradually extends upward under the combined action of the tensile and compressive stress of the roof. At this time, the roof layer began to gradually delaminate, followed by continuous caving (Figures 8(e)–8(g)).④In the later period of the continuous caving, a 71° large-angle fracture line appeared on the left side of the model. After a period of development of the fracture, instantaneous roof collapse occurred in the model.
4.2. Strain and Stress Analysis
The VIC-3D data analysis software is used to extract the local displacement values of points A, B, C, D, E, F, G, H, I, and J on the surface of the model (see Figure 6), and the displacement trend during the whole experiment is plotted (see Figures 9(a) and 9(b)). In addition, the pressure values of points A, B, D, E, F, G, H, I, and J collected by the pressure sensor are plotted as curves (see Figures 10(a) and 10(b)).

(a)

(b)

(a)

(b)
As can be seen from the displacement trend diagram in Figure 9, after the excavation of No. 1 pillar, all monitoring points begin to settle, and the sedimentation rate of E, F, and I points rises first, and the settlement rate is the largest. After the excavation of No. 1 pillar is completed, points E, F, G, and J will continue to settle for about 50 s. During the excavation of the No. 1 pillar, the settlement amount is large in the middle of the goaf and small in the two sides. Due to the effect of No. 2 pillar, the excavation of No. 1 pillar has less influence on the settlement of four monitoring points A, B, C, and D. After the excavation of No. 2 pillar, the settlement rates of B and D near the pillar roof begin to rise first and reach the maximum. The overall settlement shows the characteristics of large in the middle and small in the two sides and large in the upper part and small in the lower part. After the excavation of No. 2 pillar, all monitoring sites still keep the settlement trend of about 220 s. After the simulated bottom drawing project starts, the settlement rates of points A, B, G, and J begin to rise first and reach the maximum, and then the overall settlement trend is regular. The settlement of the whole simulated bottom drawing process presents the characteristics of large, middle, and small two sides, and the settlement of G and J points at the other end of the excavation position is the least. When continuous caving occurs, the displacement of points G and J rises. This is because the effect of cantilever beam causes the pressure in the middle of the model to produce a component force along the direction of gravity on the slope before caving occurs. After caving is completed, the pressure disappears, so the displacement of points G and J rises.
It can be seen from the vertical pressure variation trend diagram in Figure 10, after the excavation of No. 1 pillar, since the span of K1 pillar is small, positions of F and G are close, and their variation trends are also similar. E is close to the center the connected goaf of A and B, and the pressure value at point I drops first, and then point I drops accordingly. The rate and range of decline at point E are greater than those at point I, while H and J at the top rise slowly. Points D and B are located above pillar 2. After the excavation of No. 1 pillar, the pressure was transferred to both sides, resulting in the pressure value of B and D increasing at the same speed and range. At the same time, the pressure value of points F and G increases, and the pressure value of point G increases faster than that of points F and J. After the excavation of No. 2 pillar, the pressure values of B and D begin to decrease first, and the pressure values of E and I then decrease. The decreasing rate of B is greater than that of D, and the decreasing rate of E is less than that of D. On the contrary, the pressure values of points H, G, and J all show an upward trend, and the growth rate is greater than that of H, and the growth rate of G is greater than that of J. After the beginning of the drawing project, the pressure at points F, G, and J increased, while the pressure at other points decreased to some extent. Point A starts to decline first and has the largest rate of decline; then points A, D, and E decline in turn.

(a)

(b)
(c)

(d)
4.3. Discussion
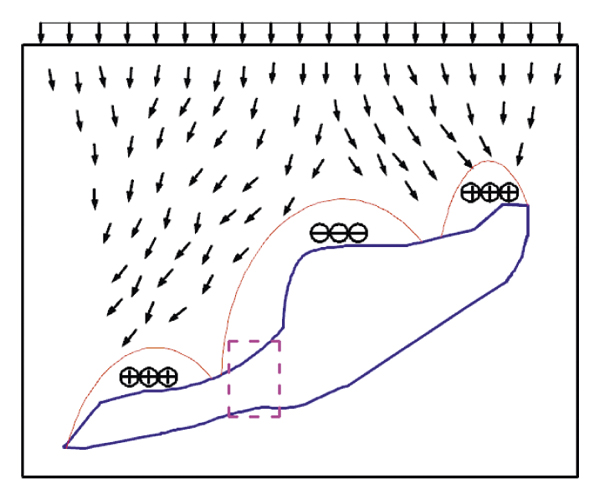
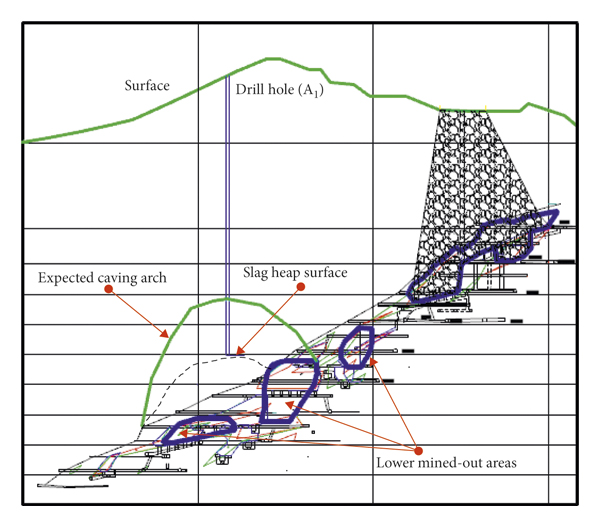
(1)In order to ascertain the temporal and spatial evolution of the deformation and failure of the surrounding rock induced by multi-mined-out areas, we need to analyze the impact mechanism of rock mass instability on the safety of mine production and the stability of the mined-out areas system. Therefore, based on the rock deformation and failure mechanism obtained by the analysis in 4.1, combined with the stress and strain change law obtained during the experiment (Figures 8 and 9), we discuss the overall instability law of the coordinated effect of the roof-pillar system in the mined-out area and propose the caving control and safety management technology in the goafs of Paishanlou. After the excavation of the pillars between the mined-out areas in a balanced state, the surrounding rock deforms, which leads to changes in stress. For purpose of maintaining the balance, the surrounding stress field transfers spontaneously to seek a new balance. Therefore, the balance of goaf system is essentially a stress balance. In order to ascertain the law of caving in the goaf, the transfer of the stress field and the law of pressure increase and release of the roof-pillar system are first studied. Before the excavation of the pillar, the roof-pillar system is in a balanced state. There is a pressure-bearing area above the pillar (indicated by “㊉” in the figure, and the number of ㊉ qualitatively indicates the pressure-bearing value), and the upper area of mined-out areas is the pressure relief area (indicated by “㊀” in the figure, and the number of ㊀ qualitatively represents the pressure relief value) (Figure 11(a)); the arrows represent the transfer of pressure. After the excavation of the No. 1 pillar, the upper area of K12 begins to relieve pressure, then the pressure gradually shifted to the No. 2 pillar and the right side bank, and the No. 2 pillar was the main pressure-bearing area. At this time, the stress above the goaf of K1 does not change significantly, indicating that the stress transfer was blocked by the No. 2 pillar, and the No. 2 pillar shows obvious stress concentration (see Figure 11(b)). After the excavation of the No. 2 pillar, the goaf is connected as a whole. The sudden release of the high stress above the No. 2 pillar caused an instantaneous pressure relief in the middle part, and the stress shifted to the two sides and the pressure value of the left slope was greater than that of the right slope. This is on account of the excavation sequence of the pillars and the buried depth of the goaf (see Figure 11(c)). After the start of the induced undercutting project, with the increase of the span of the mined-out area, the rock mass began to cave sporadically, and the pressure above the caving zone was slowly relieved at this time. At the same time as the phenomenon of separation of rock mass occurs, the pressure relief rate of the caving zone suddenly increases, and the two slopes on both sides also increase suddenly, and the rock mass begins to cave continuously. The fracture line caused by the caving gradually developed to the near-surface area, and after a period of stability, a sudden and instantaneous large caving occurs (see Figure 11(d)).(2)Since the lower mined-out areas are not allowed to penetrate to the ground surface, so as to achieve reasonable and efficient recovery of ore while dealing with the goaf, we have formulated a coordinated scheme for pillar mining and goaf filling through surface borehole. Taking into account the safety and efficiency factors, it is better to wait for the mined-out areas to cave to a certain height before filling it, but it is necessary to prevent sudden penetration to the ground. Because the higher the caving height of the goaf is, the smaller the drilling depth is, and the larger the filling range is. It can be seen from the test that, during the entire caving process, sporadic caving is the least destructive to the stability of the rock mass, and instantaneous large caving is the most destructive. Therefore, we should control the caving process in the later period of the sporadic caving to the initial period of continuous caving. According to the results of the previous analysis, there will be obvious roof separation phenomena during the transition from sporadic caving to continuous caving. In addition, the angle of the fracture line inside the rock mass, the vertical strain, and the pressure of slopes on the two sides have increased significantly. Hence, we monitor the roof rock caving process of the mined-out areas by drilling surface monitoring holes, combined with the RG underground TV, and expand the monitoring boreholes at a predetermined time and then fill the mined-out areas through borehole A1 to control the caving process. Through monitoring, we can see that the mined-out areas are currently in the sporadic caving phase (Figure 12). Test has proved that the process of induced caving in the multi-mined-out areas can be controlled artificially, and the mined-out areas can be treated efficiently while the residual ore is mined, which has certain guiding significance for the production of similar mines.
5. Conclusion
Through indoor similar physical model tests, using noncontact full-field displacement measurement systems and resistive pressure sensors as monitoring methods, we recorded in detail the stress and strain trend of surrounding rock during the process of penetration and undercutting of the multi-mined-out areas and summarized and analyzed the deformation and failure characteristics of the rock mass and the temporal and spatial evolution law of the stress and strain with the caving of the mined-out area. The main conclusions are as follows:(1)The rock caving is mainly divided into three stages: the first stage occurs above the left arch angle of the first undercutting project, the fracture angle is 59°, the caving in this stage is slower, and the lumpiness is small. The stage occurs at the top of the caving arch, and the fracture angle is 57°. This stage has a large caving block; the third stage is an instantaneous roof caving, and there is a stable period of about 3 minutes before the roof caving. The fracture angles of the sides are 71° and 58°, respectively, because the large horizontal stress of the roof will limit the dilatancy space of the surrounding rock of the roof.(2)A sudden increase in the fracture angle occurred in the upper area of the undercutting position before the instantaneous caving of the top, and the curvature of the caving suddenly increased. The instantaneous caving of the top plate is the continuation of the caving of the vault, which can be safely drilled. The shape of the caving arch is monitored to ensure that the goaf cave is naturally in the form of sporadic caving in the initial caving stage; that is, the time of huge caving can be safely monitored and the caving process is controllable.(3)Rock deformation is most affected by the span of the goaf, and the vertical strain is inversely proportional to the depth; the rock mass stress and strain caused by the excavation of the void space column have a significant time delay phenomenon, and the time delay effect of the stress is inversely proportional to the void span. The time delay effect is inversely proportional to the gap span. During the test, the strain value shows the characteristics of high in the middle of model and low in the slope of both sides and high in the upper area and low in the lower area, while the stress shows the characteristics of high in the slope of both sides and low in the middle and high in the upper area and low in the lower area.(4)The excavation sequence of the pillar will affect the stability of the roof-pillar system in the goaf. The pillar excavated first will have a stress concentration effect on the pillar excavated later and the surrounding rock mass, resulting in the local destruction of the rock mass, thereby affecting the layout of the inducing project and the process of caving in the mined-out area.(5)According to the law of caving in multi-mined-out areas obtained from the test, combined with the RG underground drilling monitoring technology, the caving process of the goafs can be effectively controlled. Thereby it can provide favorable conditions for the filling, mining, and ore drawing work of the goaf. At the same time, it has reference significance for the management of multi-mined-out areas in similar mines.
Data Availability
No data were used to support this study.
Conflicts of Interest
The authors declare that they have no conflicts of interest.
Acknowledgments
This study was supported by the National Natural Science Foundation of China (no. 51534003) and National Key R&D Program Project of China (no. 2016YFC0801601). The agencies’ funding is gratefully acknowledged.