Abstract
In this study, the failure mode of flexible reinforced soil slopes under earthquake action was investigated by shaking table tests. The distribution law of a potential failure surface of a flexible no-faceplate reinforced soil slope under earthquake action was obtained based on the analysis results. A simplified trilinear failure surface suitable for flexible reinforced soil slopes without faceplate was proposed. Subsequently, based on the upper-bound theorem of limit analysis, we derived the formula for calculating the yield seismic acceleration coefficient of a flexible no-faceplate reinforced soil slope under a seismic load. The main parameters that affect its seismic performance were determined. The flexible geogrid reverse-packed reinforced earth structure can effectively limit the fracture of a slope body and improve the stability of the slope. This provides a theoretical basis for facilitating the engineering of flexible reinforced soil slopes.
1. Introduction
Earthquake disaster investigations have revealed that road damage caused by earthquakes occurs mostly on the roadbed, embankment, or supporting structure along the road, thereby inducing nonuniform settlement, collapse, and landslide of the foundation. In the Wenchuan earthquake in China, 348 retaining structures underwent various degrees of damage. Of these, the gravity-type retaining structure accounted for 97.1% of the damage to the retaining wall [1].
Earthquakes occur in weak strata. Reinforced soil retaining structures increase the strength of the soil owing to the reinforcement added to the soil, thereby forming a composite material with the soil. In recent years, reinforced earth retaining structures have demonstrated efficient seismic stability in seismically active areas. For example, in the Wenchuan and Taiwan Jiji earthquakes, the embankment slope supported by geogrids or other reinforcement materials that were applied during the filling showed minimal earthquake-induced damage, which included a few damaged reinforced supports. A few of the damaged reinforced retaining structures were less vulnerable to damage; thus, their functions were not significantly affected. Most reinforced soil retaining structures primarily exhibited local deformation and failure, which is unlike the severe overturning and collapse of traditional gravity retaining structures. Nevertheless, there were few cases of overall failure. Therefore, the flexible reinforced earth retaining structure has received extensive attention in geotechnical engineering [2–6].
At present, research on reinforced soil retaining structures is conducted based on theoretical analysis, numerical simulation, and experiment.
Latha et al. [7] performed theoretical analysis and compared reinforced soil slopes and unreinforced slopes. They reported that during the dynamic response to earthquakes, the tensile strength of the reinforcement plays an important role in controlling its seismic deformation. Krishna et al. [8] studied the influence of the reinforced form and the surface layer on the displacement and acceleration amplification effects of the reinforced earth retaining wall and rigid panel. Lin et al. [9] compared the seismic dynamic response of unreinforced slopes with that of reinforced slopes. They observed that the magnification of the vertical acceleration of a reinforced embankment slope is significantly smaller than that of an unreinforced slope.
Bathurst et al. [10] used the finite difference program FLAC to perform numerical modeling and analysis of reinforced earth retaining walls with continuous integral rigid panels. They observed that the constraints of the wall toes significantly influence the seismic dynamic response of the reinforced body. Mendon [11] applied numerical program modeling to analyze the performance of a geogrid-reinforced embankment under the action of ground motion. In addition, they studied the effect of different damping ratios on its dynamic response. Haishen et al. [12] used a finite element program to develop an elastoplastic constitutive model of reinforced soil. They verified that the model can better solve the simulation problem of reinforced soil boundary through dynamic working conditions. Baohua et al. [13] used the SLIDE software to study the response of reinforced soil slopes under the combined effects of earthquake and precipitation. They observed that the cracks resulting from an earthquake intensify the infiltration of rainwater and cause the slopes to be more vulnerable to damage.
Xianjing et al. [14] conducted the original ruler slope model test to experimentally study and observe the destructive behavior and mechanism of a slope under an earthquake. They studied the influence of parameters, such as reinforcement density and length of the reinforcement material, on the potential slip surface. Jian et al. [15] conducted shaking table tests on plain and geogrid-reinforced earth embankments to investigate the influence of morphology. They observed that the addition of a geogrid resulted in a largely uniform distribution of earth pressure and significant reduction in the amplitude of dynamic earth pressure.
Li et al. [16] proposed a method based on the theorem of limit analysis to address slope stability. In addition, they used parameter studies to illustrate the influence of the direction and position of the anchor on slope stability. The kinematic method based on the limit analysis framework proposed by Porbaha et al. [17] was used to analyze the stability of the model for enhanced vertical and inclined walls with viscous backfill. Ausilio et al. [18] calculated the seismic stability of slopes reinforced with geosynthetics by applying the kinematic theorem of limit analysis. They proposed a suitable procedure for designing reinforced slopes in seismically active areas.
In summary, the theory of seismic response analysis of wrap-reinforced soil slopes is not fully developed for engineering practice. The current research on the seismic performance of flexible geogrid wrap-reinforced earth structure poses the following challenges: (1) the seismic dynamic response law of geogrid wrap-reinforced earth structures is based mostly on numerical simulation. (2) The failure of a wrap-reinforced slope under the action of ground motion has not been verified by tests. Considering these, in this study, the shaking table test method was implemented to investigate the failure mechanism and mode of flexible reinforced soil slopes under an earthquake action.
2. Shaking Table Test of Reinforced Soil Slope
2.1. Test System and Equipment
The shaking table test was performed on a reinforced soil slope at the Beijing Huixian Earthquake Engineering Comprehensive Laboratory, Institute of Engineering Mechanics, China Earthquake Administration. A large three-way electro-hydraulic servo seismic simulation shaking table was used. In the experiment, a horizontal layered shearing soil box was selected as the preparation and bearing soil box of the test model. The box contained multiple layers of steel rectangular layered frames that were independent of each other. Multiple rolling bearings were installed between the frames of two layers. Hence, each layer could produce a certain relative misalignment when the ground was subjected to vibration, thereby permitting a particular amount of shear deformation of the soil. Furthermore, the box could reduce the reflection and scattering of seismic waves at the boundary. The simulated free field boundary conditions are highly effective boundary conditions for indoor tests. The structure and vibration isolation techniques could effectively reduce the influence of the model box on the vibration characteristics of the model soil [19]. The model box is demonstrated in Figure 1.

The relevant technical indicators of the shaking table are listed in Table 1.
The sensors used in the test are listed in Table 2.
2.2. Experimental Model
2.2.1. Model Geometry
We performed full-scale model tests. The geogrid wrap-reinforced soil slope used in this test was designed according to the bearing capacity of the table and size of the model box. Its geometric dimensions are shown in Figure 2.

2.2.2. Model Materials
The foundation at the bottom of the reinforced soil slope had a thickness of 10 cm. The reinforced soil slope was divided into seven layers, each with a thickness of 20 cm. A wrap-reinforced design was adopted for the flexible geogrid. A front panel was not provided for any layer. Grass seed bags were used as templates after being filled and compacted. The geogrid below each grass seed bag was wrapped around the bag. Silty clay was used as the backfill material. We used a mesh screen with a small aperture (5 mm) to remove grass, branches, gravel, and other impurities from the backfilling soil to eliminate their impact on the test results. The physical properties of the filler determined by a proctor compaction test are shown in Table 3.
EGAl00-100 fiberglass geogrids (Table 4) were used as the reinforcement.
2.2.3. Sensor Arrangement
An accelerometer, a cable displacement gauge, and a horizontal earth pressure cell were arranged in each layer along the slope from the bottom to the top. This was to observe the variation in acceleration along the slope body height, deformation of the slope surface, and distribution of earth pressure along the slope body height, respectively. The strain gages were pasted in two sections of the geogrid. In the section adjacent to the slope, three strain gages were laid at intervals of 40 cm. In addition, strain gauges were pasted on the free end near the back of the box, at distances of 20 cm and 100 cm from the wall. Jack displacement meters were placed on the slope surface at intervals of 30 cm from the soil box wall at the back of the slope body. This was to measure the settlement value of the top of the slope under the action of ground motion. The arrangement of test sensors is shown in Figure 3.

2.2.4. Loading Scheme
Because the seismic safety performance of the structure could be tested effectively to obtain its dynamic characteristics, the EL-Centro seismic wave was selected as the bottom excitation input [20]. To understand the destruction mechanism of geogrid-reinforced soil slopes and observe its destruction in extreme cases, the EL-Centro seismic waves were processed to obtain seismic waves with amplitudes of 0.15 g, 0.5 g, and 1.5 g.
Horizontal unidirectional seismic waves were provided as input. Before the seismic waves were input, a section of white noise was first input to understand the dynamic characteristics of the reinforced soil slope. The specific loading conditions and sequence are listed in Table 5. After each working condition was loaded, related works, such as data viewing, recording of the external damage of the model, and photography, were conducted. All the acquisition channels were then reset to their initial modes. The model was regarded as a new model for the next working condition until the reinforcement slope was destroyed.
3. Test Results and Analysis
Under the action of the EL-Centro seismic wave with an amplitude of 0.15 g, the reinforced soil slope displayed only a marginal vibration, and no apparent deformation occurred on the slope surface or slope top. Under the EL-Centro seismic wave with an amplitude of 0.5 g, the model box swayed violently, and the soil on the top of the reinforced soil slope began to exhibit small cracks. In addition, the slope showed a marginal deformation. Under the EL-Centro seismic wave with an amplitude of 1.5 g, the cracks on the top of the slope began to increase, and the soil bags without grille-reversal near the top of the slope dropped. The slope also showed an apparent deformation. More lateral cracks were generated on the top of the slope under the action of seismic waves. The width of the widest crack was approximately 4 cm, and the depth attained 10 cm. In this test, the uppermost protective layer of soil was not reinforced. It could be regarded as a plain soil slope, whereas the lower layer of the slope is regarded as a reinforced soil slope. The reinforced soil slope displayed a seismic performance that was better than that of a plain soil slope. The final deformation is illustrated in Figure 4.

(a)

(b)
In this test, a wire-line and rod displacement meters were installed to measure the horizontal deformation of the slope and the settlement of the slope top, respectively. Two types of displacement meters were installed to observe the deformation law of geogrid wrap-reinforced soil slopes for ground motions of different amplitudes.
The distribution diagram of the horizontal displacement of the slope with respect to the slope height is drawn (Figure 5) considering the peak horizontal displacement of each measuring point of the reinforced soil slope under the action of the EL-Centro ground motions with amplitudes of 0.15 g, 0.5 g, and 1.5 g.

The horizontal displacement distribution of the slope under the three working conditions reveals that the horizontal displacement of the slope corresponding to the slope height from 0.2 m to 0.4 m increases significantly. The maximum horizontal displacements of the reinforced soil slope under the action of ground motions with amplitudes of 0.15 g and 0.5 g are 3.3 mm and 13.8 mm, respectively. Both the working conditions produce large displacements in the middle and low parts of the slope. The deformation law is consistent with the central bulge and uplift phenomenon revealed by earthquake damage investigations.
The slope settlement monitoring points were arranged on the surface of the reverse cladding of the first, fourth, and seventh layers of geogrid. The horizontal distances of the corresponding measurement points from the slope foot were 0 m, 0.3 m, and 0.6 m, respectively. The peak value of the vertical settlement at each measuring point corresponding to the three working conditions is considered to plot the vertical settlement of the reinforced soil slope along the horizontal direction of the slope. The distribution diagram of vertical settlement is presented in Figure 6. The maximum point of the vertical displacement of the slope under the three conditions is at the base of the slope.

We plotted the distribution of horizontal earth pressure along the slope considering the peak of the horizontal earth pressure at each measuring point under the three working conditions along the slope height. The pressure distribution diagram is presented in Figure 7.

The maximum horizontal earth pressure on the slope is marginal (0.38 kPa) when a seismic wave with an amplitude of 0.15 g is provided as input to the base. It increases noticeably when the amplitude increases to 0.5 g. Finally, it increases marginally when the amplitude increases further to 1.5 g. The horizontal earth pressure curves for the 0.5 g and 1.5 g conditions show a downward trend from the middle to the lower parts of the slope.
The strain gauges attached to each layer of the geogrid were used to monitor the tensile deformation of the geogrid under the action of ground motion. To simplify the analysis, each layer of geogrid was divided into the main rib and reverse wrapping sections. The reverse wrapping section is the part of the geogrid that is turned over to wrap the grass seed bag, thereby forming the surface layer of the reinforced soil slope. The strain of each measuring point increased when the ground motion was input, attained the maximum value, and then stabilized gradually.
The peak value of the strain time-history curve at each measuring point of the first geogrid’s main reinforcement section under the ground motions of different amplitudes was considered to plot the strain distribution diagram of the geogrid. The strain distribution diagram is illustrated in Figure 8, which shows that the strain at the main rib section of the first layer of geogrid near the slope is large under the action of the ground motion and various working conditions, whereas those at the middle and end sections are marginal.

The geogrid strain distribution diagram along the slope height of each layer is demonstrated in Figure 9. The variation law of the maximum strain of the geogrids of each layer of the reinforced soil slope for ground motions of different amplitudes can be obtained from this diagram. The strain distribution curves of the three working conditions have a large local value at 0.4 m, which is consistent with the horizontal displacement distribution curve of the slope. A large slope displacement occurs in the middle and lower parts of the reinforced soil slope under the action of ground motion. This results in an increased strain of the geogrid. This part of the slope also undergoes bulging deformation. The deformation of the reinforced soil slope and the strain of the corresponding geogrids are marginal under the action of ground motions with an amplitude of 0.15 g. A more apparent law of distribution of grid strain among the grid layers is observed when the local vibration amplitude increases. The maximum grid strain for ground motions with amplitudes of 0.5 g and 1.5 g appears at 1.4 m, which corresponds to the uppermost grid. Meanwhile, the minimum value appears at 0.2 m, which corresponds to the lowermost grid.

Considering the strain of the geogrid as the criterion for assessing the failure of the reinforced embankment, the connection line of the maximum strain point of each geogrid layer is the fracture surface that is most likely to be damaged. The potential rupture surface of the flexible reinforced soil slope begins to extend into the interior of the slope as the amplitude of the seismic wave input to the basement increases. However, the variation trend of the potential rupture surface along the height is largely identical, i.e., it varies gradually along the height to the interior of the slope. Finally, the surface expands abruptly inward at the top of the slope, as shown in Figure 10.

The potential fracture surface is the basis for the design of the reinforcement. The common hypotheses of potential fracture surface used in reinforced soil structures include Rankine destruction surface, which is adopted in FHWA-NHI-10-024 [21]; 0.3H simplified fracture surface, which is used in BS 8006 2010 [22]; and Lei Shengyou’s logarithmic spiral fracture surface, which was proposed based on Lei Shengyou’s centrifugal model test of a double-sided reinforced high-retaining wall [23]. From Figure 10, the location of the measured potential fracture surface coincides with the three-fold line.
A simplified fracture surface with a three-fold line, as illustrated in Figure 11, is proposed. Zones I and II are the active and stable zones, respectively.

To verify the adaptability of the trilinear fracture surface mentioned in the manuscript, the measured data of the reinforced soil wall under the peak value of different seismic waves presented in reference [24] are considered. As shown in Figure 12, the potential trilinear fracture surface has appropriate adaptability.

In addition, the numerical simulation results are in good agreement. This is verified in reference [25].
The deviation of the model from the actual value can be expressed by model uncertainty. A general methodology for assessing and reporting model uncertainty is recommended in reference [26]. The present study conducted a quantitative analysis of the uncertainty of the trilinear potential fracture surface model based on the relative horizontal location of the maximum strain in the slope at an identical height. The model factor was used to evaluate the uncertainty of the model, i.e., the mean value of represents the average accuracy of the model. The mean value of in the model () and coefficient of variation () were determined to be 0.90753 and 0.0276, respectively, by comparing and analyzing 188 sets of data with the predicted potential fracture surface model. Figure 13 shows the plots of calculated versus predicted horizontal ratios of potential fracture locations.

Figure 14 shows the plots of the values for the simplified model with respect to the predicted fracture locations.
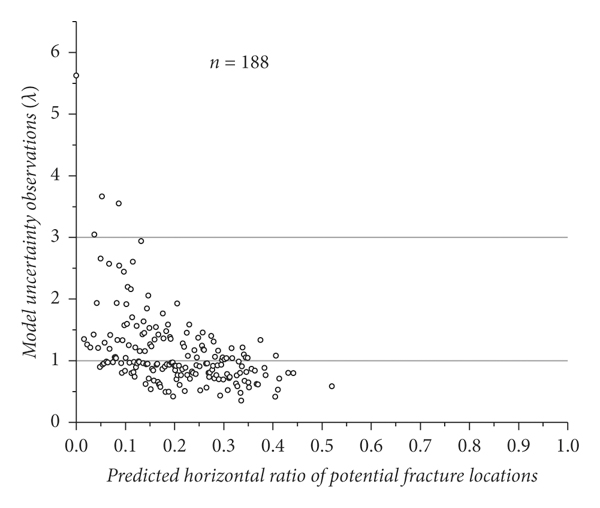
In general, as the fracture surface expands to the interior of a slope, decreases accordingly. Among the 188 sets of data, >3 was observed for only three data points, indicating that the dispersion between the predicted and actual values is highly marginal. The trilinear simplified fracture surface model conforms well to the actual fracture surface of the reinforced soil slope.
4. Limit Analysis
In this study, the upper limit method of plastic limit analysis was used to analyze the potential failure surface of the flexible reinforced soil slope and obtain the yield acceleration coefficient. The theorem assumes that soil moves in the form of a rigid plastic body when a slope fails. The theorem requires that the energy dissipation power must be at least equal to the external force power for any maneuverable failure mechanism [27]. The external force power includes the power generated by the slope soil weight and seismic load. The internal energy dissipation power includes the rate of energy dissipation to the reinforcement and the rate of energy dissipation caused by the cohesive force of the soil on the fracture surface. We ensured that the energy dissipation power was equal to the external force power to obtain the yield acceleration coefficient of the flexible reinforced soil slope.
4.1. Basic Assumptions
Because the failure mechanism of flexible reinforced soil slopes is complex, the following fundamental assumptions were made to simplify the research object and facilitate the analysis of the potential fracture surface of slopes:(1)The soil body of the flexible reinforced soil slope is an ideal rigid plastic body, satisfies the Mohr–Coulomb failure criterion, and complies with the relevant flow rules [28];(2)The flexible reinforced soil slope body satisfies the plane strain assumption;(3)The shape of the potential fracture surface of the slope is a trifold line to simplify the fracture surface. In addition, the most hazardous fracture surface passes through the slope foot;(4)The seismic effects on flexible reinforced soil slopes are replaced by pseudostatic forms.
4.2. Model Analysis
According to the principle of virtual power, the external load power and internal energy dissipation power of a flexible reinforced soil slope system satisfies the following conditions:where is the system volume, is the surface area, is the surface force, is the volume force, is the displacement field, is the stress field, is the strain field, and and indicate the directions of action [29].
The permitted motion velocity field is constructed according to the limit analysis theory and relevant flow rules (see Figure 11).
4.3. Calculation of Energy Dissipation Power
4.3.1. External Load Power
The external loads applied to the flexible reinforced soil slope system include the weight of the wedge F and the seismic force. The external load power can be expressed aswhere is the total external load power, is the external power generated by the action of gravity on the wedge F, and is the external power generated by the seismic force on F.
According to Figure 10, and can be expressed aswhere represents the volume of the wedge F and can be expressed aswhere γ is the force of gravity on the F, is the horizontal seismic acceleration coefficient, and is the vertical seismic acceleration coefficient ().
4.3.2. Internal Energy Dissipation Power
When the soil body becomes unstable owing to the destructive sliding mechanism, the energy dissipation rate in the system includes the energy dissipation rate of the reinforcement and that generated by the cohesion of the soil on the fracture surface. The internal energy dissipation power can be expressed aswhere is the total power dissipated in the soil, is the energy dissipation rate generated by the cohesion of the soil to the discontinuity, and is the energy dissipation rate to the geogrid reinforcement. The internal energy dissipation rate owing to soil cohesion on the discontinuity iswhere c denotes the cohesion of the soil.
The ribs in the slope are laid at equal intervals. Assuming that these have sufficient length and do not pull out and break, all the losses would occur between the velocity discontinuities. In Figure 15, η denotes the angle between the directions of the fracture surface and the rib, and t denotes the thickness of the fracture layer.

We assume that the tensile strength of the reinforcement is uniformly distributed on the entire fracture surface. is the reinforcement spacing. Thus, the density of the reinforcement is the tensile strength of the reinforcement at the unit interface and can be expressed as
The energy dissipation rate per unit area of the velocity discontinuity surface owing to tensile failure of the reinforcement can be expressed aswhere is the strain rate in the direction of the reinforcement, , and is the tensile strength of the reinforcement at the unit interface.
The energy dissipation rate of the reinforcement on the entire fracture surface owing to tensile failure is derived as follows:where
4.4. Earthquake Yield Acceleration Coefficient
According to the upper limit theorem of limit analysis, the external force power is equal to the internal energy dissipation rate. When , the unsafe upper limit of the destructive load (i.e., the seismic yield acceleration corresponding to the slope that remains stable under the action of the seismic load ()) can be obtained:
Substituting equations (3)–(5), (7), (10), and (11) into equation (12), it is observed that the seismic yield acceleration coefficient of flexible reinforced soil slopes is related to and . Therefore, kcs can be expressed as
5. Factors Influencing Earthquake Yield Acceleration
The factors that affect the seismic yield acceleration coefficient of flexible reinforced soil slopes are discussed according to the calculation formula of yield acceleration coefficient derived by limit analysis. The reference value of each design parameter of the slope is defined as follows: slope height H = 14 m, soil weight γ = 18.5 kN/m3, soil cohesion c = 25 kPa, friction angle φ = 21°, tensile strength T = 100 kN/m, and vertical spacing of reinforcement s = 1 m. The parameters of the potential fracture surface are as follows: a1 = 0.3, a2 = 0.5, a3 = 0.2, θ1 = 0.436, θ2 = 1.57, and θ3 = 0.436.(1)The influence of H on is depicted in Figure 16. decreases gradually as H increases. The decreasing trend then becomes slower.(2)The influence of the tensile strength T of the reinforcement on is presented in Figure 17. increases gradually as T increases.(3)The influence law of the vertical distance s of reinforcement on is shown in Figure 18. decreases gradually as s increases. Moreover, the decreasing trend becomes slower.(4)The influence law of soil cohesion c on is shown in Figure 19. increases gradually as c increases.


represents the maximum seismic acceleration that the reinforced soil slope can withstand while maintaining stability. Designers can select the value according to the strength grade requirements of the slope. The aforementioned four factors related to substantially affect the resisting mechanism owing to their aleatory uncertainty. Therefore, these can be assumed to be the relevant random variables. Finally, design formulas that conform to a specific level of reliability would be derived [30].
6. Conclusion
In this study, shaking table tests were performed on flexible retaining walls. The following major conclusions were drawn from the results obtained:(1)The results show that the horizontal displacement and vertical settlement of a flexible reverse-packed geogrid-reinforced soil slope are large near the middle and lower parts of the slope surface. The point of maximum horizontal displacement shifts to the outside of the soil, and a bulging phenomenon occurs on the slope.(2)According to the distribution of the maximum strain point of the geogrid, the potential fracture surface first expands gradually into the slope along the height and then expands abruptly inside the slope at its top.(3)Finally, the trilinear potential fracture surface was obtained, unlike the studies in the literature. The trilinear model is more consistent with the fracture surface than the existing 0.3H polyline, Rankine fracture surface, and logarithmic spiral line.(4)The yield acceleration coefficient of the upper limit solution of a flexible reinforced soil slope is derived using the limit analysis method based on the trilinear potential fracture surface. The parameter analysis shows that the slope height, tensile strength of the reinforcement, reinforcement spacing, and cohesion of the backfill exert significant influence on the yield acceleration.
Data Availability
The data used to support the findings of this study are included within the article.
Conflicts of Interest
The authors declare that they have no conflicts of interest.
Acknowledgments
This study was supported by the National Key Research and Development Program of China (Grant no. 2016YFE0205100).