Abstract
Gait recognition-based person identification is an emerging trend in visual surveillance due to its uniqueness and adaptability to low-resolution video. Existing gait feature extraction techniques such as gait silhouette and Gait Energy Image rely on the human body’s shape. The shape of the human body varies according to the subject’s clothing and carrying conditions. The clothing choice changes every day and results in higher intraclass variance and lower interclass variance. Thus, gait verification and gait recognition are required for person identification. Moreover, clothing choices are highly influenced by the subject’s cultural background, and publicly available gait datasets lack the representation of South Asian Native clothing for gait recognition. We propose a Dynamic Gait Features extraction technique that preserves the spatiotemporal gait pattern with motion estimation. The Dynamic Gait Features under different Use Cases of clothing and carrying conditions are adaptable for gait verification and recognition. The Cross-Correlation score of Dynamic Gait Features resolves the problem of Gait verification. The standard deviation of Cross-Correlation Score lies in the range of 0.12 to 0.2 and reflects a strong correlation in Dynamic Gait Features of the same class. We achieved 98.5% accuracy on Support Vector Machine based gait recognition. Additionally, we develop a multiappearance-based gait dataset that captures the effects of South Asian Native Clothing (SACV-Gait dataset). We evaluated our work on CASIA-B, OUISIR-B, TUM-IITKGP, and SACV-Gait datasets and achieved an accuracy of 98%, 100%, 97.1%, and 98.8%, respectively.
1. Introduction
Gait recognition for person identification is gaining importance because it is distinct enough for biometric identification and difficult to hide or morph. While face, eyes, and fingerprints biometrics are morphed with face masks, oversized glasses, and gloves. Gait recognition for visual surveillance includes biometric identification [1, 2], gender recognition [3–5], ethnicity classification [6], age group estimation [7–9], and suspect identification in forensics [10, 11].
Gait biometric-based person identification is challenging due to variance in the viewing angle, the direction of walk, speed of the walk, clothing, and carrying items. Among all these challenges, the subject’s appearance is critical because it varies daily and alters his/her body’s shape. The shape of the subject’s body is the primary visual cue for gait feature extraction. Additionally, loose clothing reduces the gait dynamics’ visibility, such as self-occlusion due to long coats and gowns, reducing the lower limb’s visibility, while carrying items like handbags and satchel adds swinging motion as dynamic noise.
The challenge of gait recognition robust to appearance variance introduces two significant issues: higher intraclass variance and lower interclass variance. Higher intraclass variance refers to the phenomenon in which the same subject looks differently in different clothing combinations. Lower intraclass variance refers to the phenomenon in which different subjects look similar in similar clothing combinations. Higher intraclass variance requires gait verification before gait recognition. This paper proposed Dynamic Gait Features (DGF) extraction that preserves spatiotemporal gait dynamics with subpixel motion estimation. The contribution of the presented work is outlined as follows:(1)A novel gait feature extraction approach, Dynamic Gait Features (DGF), is presented. The Dynamic Gait Features preserve spatiotemporal gait dynamics with the help of the subpixel motion estimation technique. The effectiveness of the Dynamic Gait Features for Gait verification is statistically proved with Cross-Correlation Score (CCS).(2)The Cross-Correlation Score is utilized as a feature vector for Support Vector Machine classifier-based gait recognition. The accuracy of our work is comparable with the existing state-of-the-art techniques.(3)A new dataset named SACV-Gait is developed to capture the appearance variance induced by South Asian clothing. Dynamic Gait Features are evaluated on the CASAI-B, OUISIR-B, TUM-IITKGP, and SACV-Gait datasets.
The rest of the paper is organized as follows: Section 2 summarizes the existing Gait feature extraction techniques. Section 3 explains the material and methods adapted in our work. Sections 4 and 5 comprise the results and discussion of our work. Section 6 briefly explains the crux of our research work.
2. Existing Work
Gait recognition techniques rely on shape-dependent feature extraction such as Gait Energy Image (GEI) and Gait Silhouette. The shape of the human body varies due to clothing and carrying items and results in gait recognition techniques’ performance degradation.
Research studies that utilize GEI for gait recognition include different GEI variants such as Multiscale Gaussian Blur Gait Energy Image (MGEI) and Skeleton Gait Energy Image. Choudhury and Tjahjadi [12] adapted multiscale Gaussian Gait Energy Image (MGEI) for clothing invariant gait recognition. In [13], Bashir et al. adapted Canonical Correlation strength of GEI for gait feature learning across different views. Wu et al. [14] employed Deep Neural Networks with GEI for gait recognition with different walking conditions. In [15], Xu et al. adapted capsule network and GEI for gait recognition robust to multiwalking conditions and multiclothes condition. In [16], Yu et al. employed Deep Neural Networks with stacked multilayer autoencoders to synthesize gait features robust to view clothing and carrying conditions. In [17], Zhang et al. adapted a Long Short Term Memory based autoencoder network for pose based gait feature learning. Yao et al. [18] utilized Skeleton Gait Energy Image (SGEI) and convolutional neural networks for gait recognition with varying clothing conditions.
Research studies that utilize gait silhouette for gait recognition include region-based feature learning, 3D gait modeling, and optical flow field-based gait feature extraction. Chai et al. [19] utilized region-based variance of gait silhouette and Nearest Neighbor classifier. Kastaniotis et al. [20] extracted histogram gait features and kernel Hilbert based feature space for sparse representation for gait recognition. In [21], El-Alfy et al. transformed contours into curvature and developed normal distance maps. Tang et al. [22] utilized contours for the 3D gait feature and adapted multilinear subspace classifiers for gait recognition. In [22, 23], 3D gait modeling with sparse reconstruction is adapted for gait recognition robust to view and clothing variance. In [24], Yu et al. adapted optical flow field and histograms for gait recognition robust to appearance variance. Mahfouf et al. [25] computed optical flow gait features for neural network-based gait recognition. In [26], Wang et al. utilized gait silhouette as a set of three images and adapted a multichannel neural network. Liao et al. [27] proposed pose based temporal spatial network for gait recognition robust to appearance variance.
The adaptation of GEI helped to preserve spatial features, but the temporal variance is not addressed. Similarly, Gait Silhouette’s adaptation restrains feature extraction to the contour level, while flat regions are not considered for gait feature extraction. We proposed the Dynamic Gait Features that preserved the gait pattern’s spatiotemporal nature and captured motion estimation between gait images.
3. Materials and Methods
3.1. Preparation of Gait Datasets
We have evaluated the proposed framework on CASIA-B [28], OUISIR-B [29], TUM-IITKGP [30], and SACV-Gait dataset. The CASIA-B dataset is considered as a benchmark for the evaluation of gait recognition techniques. The CASIA-B dataset has three Use Cases of appearance variance named normal, bag, and long coat. We have considered these Use Cases as a point of reference for appearance variance and selected similar Use Cases from OUISIR-B, TUM-IITKGP, and SACV-Gait datasets. These three Use Cases define the impact of clothing on the subject’s body shape. The first Use Case represents fitted clothing, such as a trouser shirt. The second Use Case represents clothing and carrying items that bring a slight change in the subject’s body shape, such as jackets, bags, and loose pants. The third Use Case represents loose clothing that brings a significant change in the shape of the subject’s body, such as long coats, gowns, abbaya, and kurta. Table 1 summarizes the three Use Cases for each dataset.
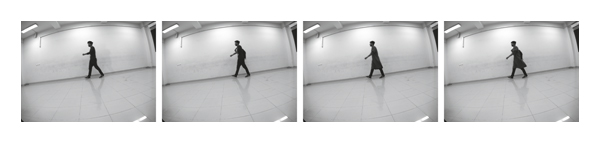
OUISIR-B gait dataset has captured the appearance variance in 32 combinations categorized into Use Cases 1, 2, and 3. Table 2 describes the codes of clothing combinations considered from the OUISIR-B dataset. Figure 1 depicts (top to bottom) use case scenarios of CASIA-B, OUISIR-B, TUM-IITKGP, and SACV datasets to evaluate the proposed work.

3.2. SACV-Gait Dataset
The SACV-Gait dataset captures South Asian ethnic clothing and accessories such as long shirts, abbaye, scarves, dupatta, and hats. The SACV-Gait dataset captured clothing and carrying items in four Use Cases named fitted clothing, fitted clothing with a bag, loose clothing, and loose clothing with a bag.
3.2.1. Ethical Data Collection and Usage
The ethical review committee of Bahria University has approved the data collection for research purposes under application number ERC/ES/002. It assures that the procedures adapted for data collection are not harmful to the participant and SACV-Gait data is collected for research purposes solely.
3.2.2. Equipment
We have used a surveillance camera model Grasshopper S2-GE-20S4M-C manufactured by Point Grey’s (FLIR Vision) for data collection. The video data has a screen resolution of 1600 × 1200 pixels with 8-bit depth and a frame rate of 30 fps.
3.2.3. Data Collection Environment
The indoor data collection setup established in Bahria University, Karachi, has a scene depth (distance between the camera and subject) of 6 meters, and participants have walked on a 12-meter long path. We installed a vision camera at the height of 2 meters, and it captured side view gait data. The viewing angle between the subject and camera changed as 45°, 90°, and 135° at the start, middle, and end of the path. Figure 2 illustrates the camera setup for gait data collection.

3.2.4. Subject Statistics
A total of 145 students participated in the research. 121 out of 145 subjects have been selected after preprocessing. We have captured gait in four Use Cases. The SACV-Gait dataset has male and female participants in 4 : 1 ratio. The age group of participants ranges between 18 and 25 years.
3.2.5. Use Cases
The SACV-Gait dataset has 121 subjects under four different Use Cases such as fitted clothing, fitted clothing with a bag, loose clothing, and loose clothing with a bag.
3.2.6. Gradual View Variance
SACV-Gait data have captured the effects of gradual view variance. According to the scene depth, length of the path, and location of the vision camera, the viewing angle at the start, middle, and end of the walking course has been observed at 45°, 90°, and 135°.
3.2.7. Other Covariates
The participants walked along a straight path in two directions (from right to left and from left to right). The surveillance camera’s adaptation for data collection provided slightly tilted images similar to real life surveillance videos. Figure 3 captures the male subject of SACV-Gait dataset in different Use Cases. Figure 4 captures the female subject of the SACV-Gait dataset in different Use Cases. Figure 5 represents the subject’s walk from left to right and from right to left direction.


3.3. Dynamic Gait Feature-Based Gait Verification and Recognition
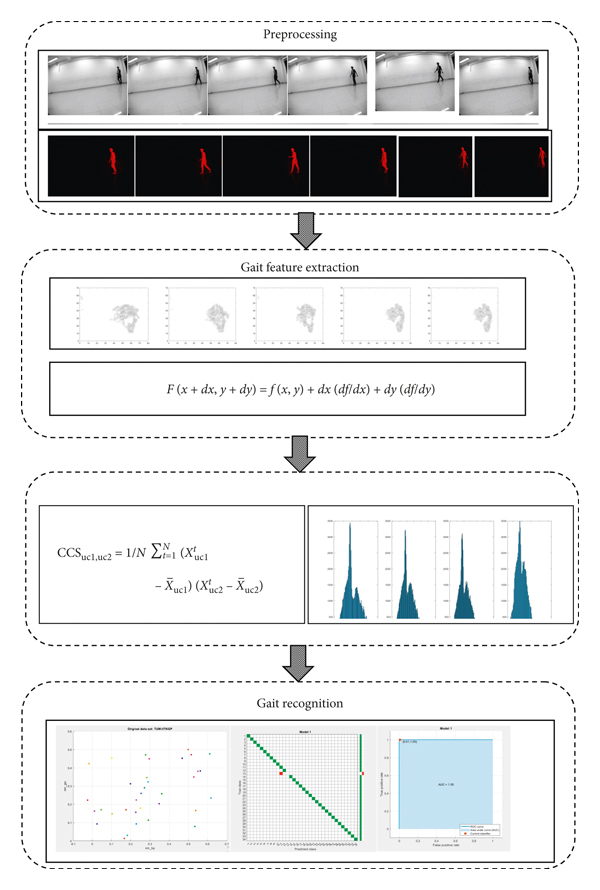
The presented research has adapted Dynamic Gait Feature extraction, Cross-Correlation Score analysis for gait verification, and Support Vector Machine based gait recognition. Figure 6 represents the complete framework of gait verification and recognition. The steps of Gait verification and recognition algorithm is provided in Algorithm 1.
|
3.3.1. Preprocessing
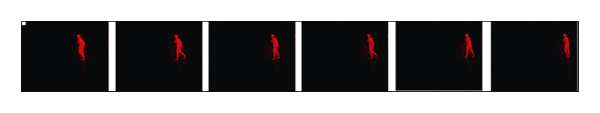
The preprocessing of gait data is performed for foreground extraction and gait cycle detection. The image differencing technique [30] is adapted for foreground extraction. Gait cycle is defined as the time interval between successive instances of initial foot-to-floor contact by the same foot [31]. For gait cycle detection, we have considered two consecutive local minima of the bounding box as the start and endpoints of the gait cycle. Figure 7 represents a complete gait cycle after preprocessing.
3.3.2. Gait Feature Extraction
The process of Dynamic Gait Feature extraction has been performed with subpixel motion estimation [32] on gait images. Following are the steps taken for motion estimation for Dynamic Gait Features:(1)Initial parameters are set for subpixel motion estimation, such as block space, search space, and gait images.(2)Sum of Absolute Difference computation has been adapted for motion estimation.(3)Motion estimation refinement has been performed with Tyler Series partial derivation.(4)The estimated motion is referred to as Dynamic Gait Features. Gait signature contains features extracted from the complete gait cycle.(5)The Dynamic Gait Features of each subject in different Use Cases were computed for Gait Signature development.(6)The Gait Signature was developed by concatenating Dynamic Gait Features
We have implemented Dynamic Gait Feature extraction with subpixel motion estimation on consecutive gait images “GI.” Let Gait cycles be captured “n” images denoted as GI1—GIn. Equations (1) and (2) summarize Tyler series-based derivative computation for motion estimation. Tyler series has simplified the complex task of multivariate derivation into partial derivatives linear functions. Equation (3) defines Dynamic Gait Feature extraction under different Use Cases where k is the number of Use Cases.
For CASIA-B, OUISIR-B, and TUM-IITKGP, k = 3.
For the SACV-Gait dataset, k = 4
In equations (1) and (2), derivation between consecutive gait images (GI) has been considered as Dynamic Gait Features. For derivative computation, the Gait Image is considered as f(x, y). The partial derivative of f(x) and f(y) represents the motion estimated between consecutive gait images as mentioned in equation (2). The estimated motion is referred to as Dynamic Gait Features. Gait signature contains features extracted from the complete gait cycle. The Gait Signature was developed by concatenating Dynamic Gait Features between consecutive GI such as (GI1, GI2), …, (GIn−1 and GIn), where n is the total number of images in the gait cycle. Figure 8 shows the Dynamic Gait Features extracted from consecutive frames of the gait cycle.

3.3.3. Cross-Correlation Strength Analysis for Gait Verification
The Cross-Correlation Scores between Dynamic Gait Features of different Use Cases are computed to analyze intraclass feature consistency. The standard deviation and relative standard deviation of Cross-Correlation Score helped determine that Dynamic Gait Features of the same subject in different Use Cases are correlated or inconsistent. The lower standard deviation of the Cross-Correlation Score (SD < 0.3) has indicated that Dynamic Gait Features under different appearances belong to the same subject. Relative standard deviation values (30%–70%) have indicated the spread of Dynamic Gait Features in the feature space. The Cross-Correlation Score helped infer that intraclass Dynamic Gait Features are correlated and consistent enough for gait verification. Equations (4)–(6) summarize the computation of covariance, mean-variance, and Cross-Correlation Score.
(1) Cross-Correlation Score (CCS). The Cross-Correlation Score provides the similarity between two time series data. The Cross-Correlation Score provides statistical evidence to analyze that Dynamic Gait Features of the same subject under different Use Cases are strongly correlated or not. The range of values for the Cross-Correlation Score varies between −1 and 1.
(2) Standard Deviation (SD). The standard deviation score reflects the variance of data points from their mean. The lower standard deviation of Cross-Correlation Score statistically proves that Dynamic Gait Features are consistent and highly correlated despite significant appearance variance. The maximum standard deviation of the Cross-Correlation Score observed was 0.3. The computation of SD of Cross-Correlation Score is explained in equation (7).
(3) Relative Standard Deviation (RSD). The relative standard deviation represents the difference between standard deviation and the mean of data points. Lower relative standard deviation indicates tightly clustered data points, and higher standard deviation values indicate the spread of data points. The relative standard deviation score lies in the range from 30% to 70%. Higher relative standard deviation values indicate that Cross-Correlation Score Gait features require nonlinear classifiers for Gait recognition. Equation (8) explains the computation of RSD. The higher relative standard deviation values indicate the spread of features and suitability of nonlinear hyperplanes for classification.
3.3.4. Classification with Support Vector Machine for Gait Recognition
We adapt Cross-Correlation Score with quadratic Support Vector Machine classifier for Gait recognition. Support Vector Machine classifier works by defining relative decision boundaries between two classes. The quadratic Support Vector Machine kernels utilize hyperplanes similar to the hyperparameters of Deep Neural Networks for classification. Deep learning-based approaches [17, 27, 33, 34] for Gait recognition also adapt hyperparameters-based Gait recognition.
Dynamic Gait Feature extraction for the SACV-Gait dataset with computational details are as follows.
We consider the gait cycle of different lengths for each dataset. Such as in the SACV-Gait dataset, the gait cycle length varies between 7 and 11 images. While in CASIA-B and OUISIR-B datasets, it lies in the range of 21 to 36 images. Cycle length = n = 7 (GI1–GI7) Image size of SACV = 1200 × 1451 × 3 Feature vector Dynamic Gait Features between 2 consecutive gait images = 60 × 72 double Feature vector Dynamic Gait Features of complete cycle = 300 × 72 double Cross-Correlation Score of Dynamic Gait Features vectors in 4 different Use Cases = 1 × 4 double. Features are computed and stored in the double format as it captures the change in magnitude in detail.
4. Results
We evaluated Dynamic Gait Feature-based gait verification and recognition on CASIA-B, OUISIR-B, TUM-IITKGP, and the SACV-Gait dataset for evaluation.
4.1. Experimental Results on CASIA-B
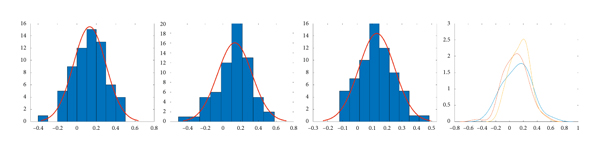
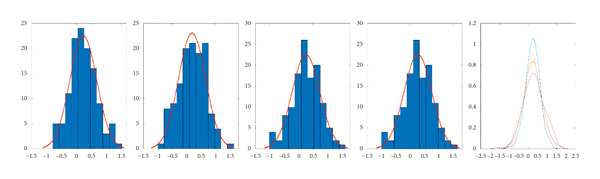
CASIA-B Gait dataset [28] consists of 124 subjects with three Use Cases named normal, long coat, and bag captured from a 90° viewing angle. The Cross-Correlation Scores of pair 1 (normal, bag), pair 2 (normal, long coat), and pair 3(bag, long coat) were further analyzed with standard deviation and relative standard deviation. The standard deviation score of pair 1, pair 2, and pair 3 was 0.12, 0.2, and 0.2. The relative standard deviation of pair 1, pair 2, and pair 3 was 30%, 50%, and 33%. We adapted Cross-Correlation Score with a Support Vector Machine for gait recognition and achieved 100%. Figure 9 represents the standard deviation plotted with a normal distribution curve for pair 1, pair 2, and pair 3. Figure 10 summarizes the scatter plot, confusion matrix, and receiver operating characteristic curve of gait recognition.


4.2. Experimental Results on OUISIR-B
OUISIR-B [29] dataset contains 65 subjects in 32 different types of clothing combinations. We classify the clothing combinations into three Use Cases as normal, loose, and long coat. Table 2 mentions the dress codes under each use case. The Cross-Correlation Scores computation of pair 1 (normal, loose), pair 2 (normal, long coat), and pair 3 (loose, long coat) were further analyzed with standard deviation and relative standard deviation. The standard deviation score of pair 1, pair 2, and pair 3 was 0.141, 0.144, and 0.140. The relative standard deviation of pair 1, pair 2, and pair 3 was 70%, 70%, and 80%. We adapted the Cross-Correlation Score with the Support Vector Machine for gait recognition and achieved 100% accuracy. Figure 11 represents the normal distribution curve of pair 1, pair 2, and pair 3. Figure 12 summarizes the scatter plot, confusion matrix, and receiver operating characteristic curve of gait recognition.

4.3. Experimental Results on TUM-IITKGP
The TUM-IITKGP dataset [30] contains 35 subjects with three relevant Use Cases: normal, bag, and gown. We further analyzed Cross-Correlation Scores of pair 1 (normal, bag), pair 2 (normal, gown), and pair 3 (bag, gown) with standard deviation and relative standard deviation. The standard deviation of pair 1, pair 2, and pair 3 was 0.141, 0.144, and 0.140. The relative standard deviation of pair 1, pair 2, and pair 3 was 60%, 50%, and 50%. Figure 13 represents the normal distribution curve of pair 1, pair 2, and pair 3. We adapted the Cross-Correlation Score with the Support Vector Machine and achieved 97.1% accuracy. Figure 14 summarizes the scatter plot, confusion matrix, and receiver operating characteristic curve of gait recognition.


4.4. Experimental Results on SACV-Gait Dataset
The SACV-Gait dataset contains 121 subjects under four Use Cases of fitted, fitted with the bag, knee down, and knee down with the bag. We further analyzed Cross-Correlation Scores of pair 1 (fitted, fitted with bag), pair 2 (fitted, knee down), pair 3 (knee down, knee down with bag), and pair 4 (fitted with the bag, knee down with bag) with standard deviation and relative standard deviation. The standard deviation score of pair 1, pair 2, pair 3, and pair 4 was 0.23, 0.22, 0.23, and 0.19. The relative standard deviation of pair 1, pair 2, and pair 3 was 54%, 50%, 44%, and 40%. We adapted Cross-Correlation Score with the Support Vector Machine classifier and achieved 98.8% accuracy. Figure 15 represents the normal distribution curve of pair 1, pair 2, pair 3, and pair 4. Figure 16 summarizes the scatter plot, confusion matrix, and receiver operating characteristic curve of gait recognition.

5. Discussion
5.1. Gait Verification
This research work adapted Dynamic Gait Features for gait verification and recognition. For Gait verification, we computed the Cross-Correlation Score between different Use Cases. The standard deviation of Cross-Correlation Score helped to understand intraclass feature dispersion. The Cross-Correlation Score with a low standard deviation score showed the consistency of Dynamic Gait Features despite significant appearance variance. Overall, the standard deviation of Cross-Correlation Score was in the range of 0.12 to 0.23. That indicates the correlation and consistency between Dynamic Gait Features of different Use Cases.
Gait verification on pair 1 (normal, bag), pair 2 (normal, long coat), and pair 3 (bag, long coat) of the CASIA-B dataset resulted in standard deviation scores of 0.12, 0.2, and 0.2. The overall variance in standard deviation was 0.08. The relative standard deviation score of pair 1, pair 2, and pair 3 was observed as 30%, 50%, and 33%. The lower standard deviation showed a higher correlation between DGF features within the same class. Relative standard deviation’s higher values indicate significant variance between Use Cases and their impact on feature dispersion.
Gait verification on pair 1 (normal, loose), pair 2 (normal, long coat), and pair 3 (loose, long coat) of the OUISIR-B gait dataset resulted in standard deviation scores of 0.141, 0.144, and 0.14. Overall variance in standard deviation was 0.003. The relative standard deviation values of pair 1, pair 2, and pair 3 were observed as 70%, 70%, and 80%. The standard deviation score was the lowest, and RSD was the highest among all datasets. The lower standard deviation score validated the adaptability of the Cross-Correlation Score for gait verification. In contrast, higher relative standard deviation values indicated the heterogeneous and spatially diverse nature of the clothing combinations considered in the OUISIR-B dataset.
Gait verification on pair 1 (normal, bag), pair 2 (normal, gown), and pair 3 (bag, gown) of the TUM-IITKGP dataset resulted in a standard deviation score of 0.18, 0.14, and 0.15. The overall variance in standard deviation was 0.04. The relative standard deviation of pair 1, pair 2, and pair 3 was observed as 60%, 50%, and 50%.
Gait verification with pair 1 (fitted, fitted with bag), pair 2 (fitted, knee down), pair 3 (knee down, knee down with bag), and pair 4 (fitted with the bag, knee down with bag) of SACV-Gait dataset resulted in standard deviation score of 0.23, 0.22, 0.23, and 0.19. The overall variance in standard deviation was 0.04. The relative standard deviation of pair 1, pair 2, pair 3, and pair 4 was 54%, 50%, 44%, and 40%. Table 3 summarizes the standard deviation and relative standard deviation score for the Cross-Correlation Score of Dynamic Gait Features.
5.1.1. Standard Deviation (SD)
The standard deviation score of all datasets lies in the range from 0.12 to 0.23. Collectively, the standard deviation score was less than 0.3. The lower standard deviation indicates that Dynamic Gait Features are highly correlated despite significant appearance variance. Standard deviation reflects the intraclass consistency of Dynamic Gait Features and assures that gait features extracted from different appearances belong to the same subject (Gait verification). Figure 17 illustrates the standard deviation of Cross-Correlation Score computed for pair 1, pair 2, and pair 3.

5.1.2. The Variance in Standard Deviation (SD)
Collectively, the variance in standard deviation ranged from 0.003 to 0.1. This pattern indicated that Cross-Correlation Score is an effective way to develop statistically consistent gait features while capturing a wide range of clothing combinations.
5.1.3. The Relative Standard Deviation (RSD)
The relative standard deviation score for Cross-Correlation Score lies in the range from 30% to 80%. Those higher values of relative standard deviation score reflected the Cross-Correlation Score variance due to significantly different Use Cases. The standard deviation score reflected the intraclass consistency of Dynamic Gait Features and assured that gait features extracted from different appearances belong to the same subject. Table 3 summarizes the standard deviation and relative standard deviation score of Cross-Correlation Score. Figure 18 represents relative standard deviation of Cross-Correlation Score computed for pair 1, pair 2, and pair 3.

5.2. Gait Recognition
For gait recognition, we compute the Cross-Correlation Score between Dynamic Gait Features under different Use Cases. This Cross-Correlation Score was utilized as the feature vector for Support Vector Machine based gait recognition. We achieved 98%, 97.1%, 100%, and 98.8% accuracy on CASIA-B, OUISIR-B, TUM-IITKGP, and SACV-Gait datasets. The proposed gait features are evaluated on CASIA-B, OUISIR-B, and TUM-IITKGP and achieve 98%, 97.1%, and 100% accuracy. Although these datasets are available in binary format and motion estimation at the global level was detected from the contour area, the presented gait features’ consistency and discriminability are significant.
The Dynamic Gait Features computed from contours are similar to normal distance mapping [35] as both techniques encode gait dynamics at the contour level. In normal distance maps, normal vectors depend on the curvature between two successive contour points [36]. The Dynamic Gait Features adaptation with motion estimation at the global level helped to encode gait dynamics at different levels and provided stable gait features regardless of high scene depth. Motion estimation with optical flow-based approaches [22, 24] performed well and provided efficient pixel flow tracking. The optical flow-based approach also interprets dynamic noise as motion due to the brightness constancy constraint. Additionally, the flat regions of silhouette images did not contribute to motion estimation due to spatial smoothness constraints [37].
5.3. Comparison with Existing Work
The proposed work performed gait recognition on CASIA-B, OUISIR-B, and TUM-IITKGP with 98%, 97.1%, and 100% accuracy. The Cross-Correlation Score of Dynamic Gait Feature enabled us to resolve higher intraclass variance and perform gait verification. We utilized the Cross-Correlation Score as a feature vector for Support Vector Machine based Gait recognition. Table 4 summarizes the accuracy of our and existing gait recognition techniques.
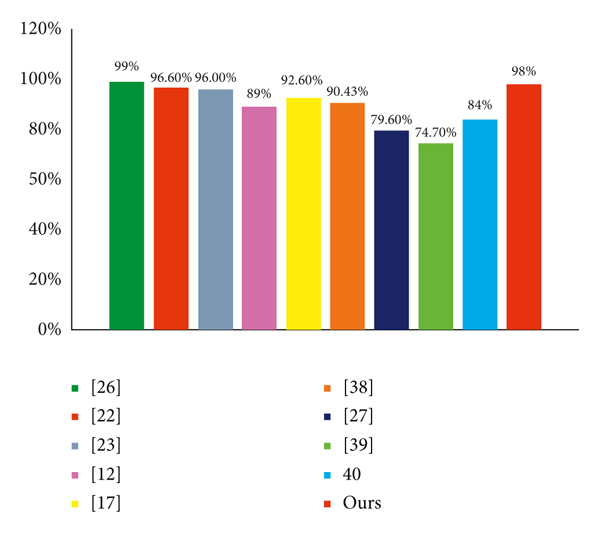
The accuracy of Dynamic Gait Features-based Gait recognition is comparable with existing feature extraction techniques such as GEI [12, 17, 38] and Gait silhouette [22, 23, 26]. State of the artwork reported in recent years [12, 17, 23, 25], and [38] are evaluated on CASIA-B dataset and achieved accuracy of 89%, 92.6%, 96%, 99%, and 90.43%, respectively. We achieved 98% accuracy on the CASIA-B dataset. Figure 19 summarizes the accuracy of our work and its comparison with existing work.
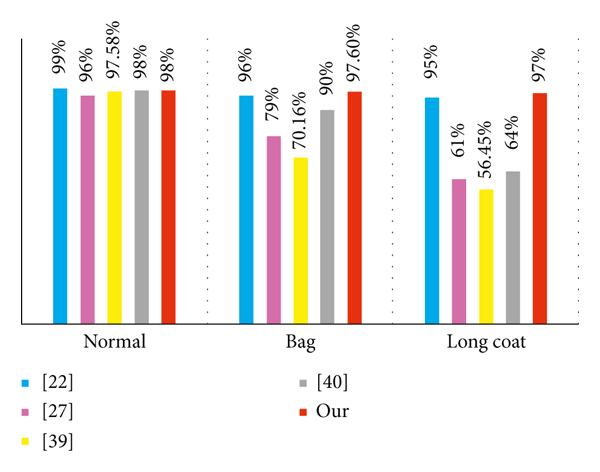
CASIA-B is a benchmark for the evaluation of gait recognition techniques. The research works reported in [22, 27, 39, 40] and presented work is evaluated for the normal, bag, and long coat-based Use Cases of CASIA-B separately. The accuracy of [22] on CASIA-B’s Use Cases normal, bag, and the long coat was 99%, 96%, and 95%. Similarly, the accuracy for Use Cases of TUM-IITKGP normal, bag, and gown cases was 99%, 80%, and 65%. Over the accuracy of [22] declines for second and third Use Case of CASIA-B and TUM-IITKGP. Accuracy of [27] is reported as 96% for normal, 79% for the bag, and 61% for a long coat. Similarly, the accuracy of [39] for normal, bag, and the long coat was 97.58%, 70.16%, and 56.45%. The accuracy of [40] is 98%, 90%, and 64% for the normal, bag, and long coat. Figure 20 graphically shows this consistent accuracy of our work and its comparison with [22, 27, 39, 40].
The research contributions of [18, 27] and presented work also reflects the adaptability of gait dynamics-based feature extraction techniques for appearance invariant gait recognition. The Dynamic Gait Features are extracted through motion estimation at the global level with varying search space sizes. Motion estimation at the global level helps to encode gait dynamics at different levels and provides stable gait features regardless of high scene depth. Motion estimation with optical flow-based approaches [22, 24] depends on pixel flow tracking and lacks robustness to dynamic noise as optical flow-based techniques interpret dynamic noise as motion due to the brightness constancy constraint. Additionally, the flat regions of silhouette images did not contribute to motion estimation due to spatial smoothness constraints [37].
6. Conclusion and Future Work
The standard deviation score and percentage accuracy for gait verification and recognition reflect Cross-Correlation Score’s effectiveness for multiclass classification problems with higher intraclass and lower interclass variance. The DGF builds consistency within the same class despite significant appearance variance. Adaptation of subpixel motion estimation preserves the spatiotemporal gait features. Additionally, the summation of DGF extracted under different appearances is a better approach than handcrafted feature extraction. In our work, the Cross-Correlation Score of Dynamic Gait Features reduces the feature dimensionality and computational complexity. Our future work includes the adaptation of DGF with neural network-based feature learning across different views and appearances.
Data Availability
The dataset will be available for future studies related to gait recognition.
Conflicts of Interest
The authors declare that they have no conflicts of interest.