Abstract
With the development of intelligent industrial production, industrial components with linear structure tend to be regular, such as TV LCD module, mobile phone screen, and electronic equipment shell. Recognition of linear structure objects by machine vision is an important aspect of intelligent industry. At present, shape matching algorithm is mostly used for arbitrary structure objects. It will be time-consuming if it is directly used to detect the linear structure objects as it needs to traverse the parameter space of the object. To solve the traversal problem and detect the linear structure objects in real time, a heuristic detection algorithm is designed according to the characteristics of linear structure objects. First, the coarse position and orientation are obtained by mean shift filtering and heuristic region grouping to reduce the searching range. Then, the heuristic search method is used to get the precise location information. The heuristic search method is designed based on the particle swarm optimization algorithm and heuristic information. The proposed method has been evaluated on two image databases of common industrial parts and backlight units which are typical linear structure objects. The experimental results showed that the proposed algorithm could reduce the detect time by more than 70% averagely while the detection accuracy is kept. It proves that the proposed algorithm can detect linear structure objects in real time and is suitable for the detection of objects with linear structures.
1. Introduction
The intelligent technology has deep into all aspects of industry. The complex manual work has been replaced by intelligent production lines. Vision systems play an important role in most of these intelligent production lines. Two typical applications are automatic visual inspection and automatic assembly. In automatic visual inspection, the vision system is usually installed at the end of the production lines to check the defects or measure the size of the product. The product will be returned to be repaired or destroyed according to different types of defects. For example, the vision system is used to automatically detect the injection mold and classify the positioning of the bushings to assist the manufacturing process of automotive components [1]. Furthermore, it is applied to detect the weld defects or measure the weld bead geometry to control the quality of the welding projects in pipeline transportation [2, 3]. In automatic assembly, the vision system is used to detect the pose of the product to guide the robot to perform the grab or film sticking or other works [4]. Components with regular structures play an important role in many industries. In particular, objects with linear structure which have many line segments on the edges or surfaces, such as the shell of the television and other similar electronic productions, occupy a large number of assemble lines. It is necessary to use the vision system to detect these components to realize automatic assembly. The working principle of vision system is that it captures the images of the offline and online object and compares their differences to get the poses of the online object [5]. The offline object and its image are considered as the reference object and the reference image. The pose of the online object refers to the relative position and orientation compared to the offline object. Then the pose is transformed into the robot coordinate system to perform specific works. Therefore, it is necessary to detect the object and acquire its pose in the image fast and accurately.
According to the different features used, the object detection algorithms are divided into general and special categories. The general category refers to the methods that can be used in any applications, namely, they are suitable for objects with arbitrary shape, such as the shape matching method [6], modified generalized Hough transform (MGHT) [7], texture matching method [4], and deep-learning-based method [8, 9]. The features include edge, texture, color, or implied comprehensive characteristics. The shape matching method can detect the objects which have rigid shapes, such as the industrial parts. MGHT adopts the way of voting to the parameter space to get the optimal pose. The texture matching method is used to detect objects with fixed texture, such as the caps and cloths. Deep-learning-based methods can extract richer features which improve the detection accuracy greatly. However, they are usually used in the case of natural scenes which can provide a large number of train images. The special category uses specially designed algorithms to detect the specific objects, for example, the weld inspection [10], the detection of agricultural products [11–13], the detection of medical disease [14–16], and the microbiological detection [17]. The specific applications decide which kind of algorithm can be used. The general one is robust and fast because they are used in the assembly lines and designed by special vision companies. Therefore, the general detection algorithms are often modified to improve the accuracy and speed to satisfy the specific filed. Currently, the detection methods for linear structure objects either directly use the general methods or use the modified methods, for example, a utility pole occlusion detection method based on the line segment detection algorithm [18], a fuzzy multiobjective approach based on a hybrid wavelet transform and fuzzy clustering method with multiobjective particle swarm optimization (PSO) for the Landsat images [19], and an improved feature extraction method based on LBP for bearing fault diagnosis [20]. These methods are fast and effective, but they still need to traverse the parameter space which is time-consuming. Although a heuristic hybrid general algorithm (HHGA) [21] was designed to reduce the searching range, it was designed for the backlight units and may not be applicable to other linear structure objects.
To solve the traversal problem and make the method applicable to general linear structure objects, this paper proposed a coarse-to-fine method which combines the heuristic information with mean shift segmentation and particle search optimization. The contributions of this paper can be concluded as follows:(1)The heuristic information of the linear structure objects is mined to be used to narrow the searching range and speed up the searching process.(2)A coarse localization method which combines the heuristic information with mean shift segmentation is proposed. And a fine localization method combines the heuristic information with particle search optimization is proposed. The coarse and fine methods can be used respectively, so they can be applied to other tasks if needed.(3)The proposed heuristic method is evaluated through experiments for typical line structure objects: common industrial parts and backlight units. It demonstrated that the proposed method can reduce the detect time by more than 70% averagely while the detection accuracy was kept.
The rest of this paper is organized as follows. Section 2 gives the related work, including shape matching algorithm and HHGA. The difference between the proposed method and the state-of-the-art methods is also given at the end of Section 2. Section 3 provides a detailed description of the proposed method. Section 4 presents experiments and the analysis of experimental results. Finally, conclusion and future research are given in Section 5.
2. Related Work
The detection of the objects with linear structure is significant to realize automatic production line. From the description of the introduction, it can be seen that MGHT [7] and shape matching algorithm [6] are suitable for this kind of objects. This paper aims to improve the traversal problem of the shape matching method with heuristic information. Therefore, the principles of the shape matching algorithm and the improvement are described in this section.
The shape matching method uses gradient to match the objects in the online and offline images. For the offline image, the model which consists of edge points and their gradient orientations are extracted with Canny edge detection algorithm [22]. The model can be denoted as, in which, n is the number of points, (, ui) is the coordinate of point i relative to the reference point, and αi is the gradient orientation of point i. The reference point can be the centroid of all points or a specified location set by the user. Gradient orientation refers to the rotation angle from vertical axis to gradient vector. For the online image, the model is moved and rotated to be matched with all points in the online image. The match refers to find an optimum position and rotation angle to maximize the similarity between the model and the online image. Let (x, y) denotes a point on the online image, β denotes the rotation angle of the model, φ denotes the gradient orientation of the point on the online image. represents the gradient orientation of the point on the online image corresponding to the ith point of the model. Similarity function can be expressed as equation (1), in which αi denotes the gradient orientation of the ith point of the model, (β + αi) represents gradient orientation of the ith point of the model after the model rotated by β, sx,y,β denotes the similarity when the model is placed on point (x, y) with rotation angle β, and cosine function is used to standardize the angle difference to [−1, 1].
As the value of cosine function is [−1, 1], the similarity defined in equation (1) also belongs to [−1, 1]. The similarity is 1 when the gradient orientations of the points of the model and online image are the same as each other, and this was the optimum pose. Thus, the aim of the shape matching method is to find the best x, y, and β. This needs to go through the image with possible rotation angles. It is known that the traverse is time-consuming. Although the pyramid algorithm is helpful to speed up the searching process, the traverse in the top layer is inevitable.
The improvement of the shape matching algorithm refers to HHGA [21] which is used to detect the pose of the backlight units in LCD module assembly. It uses the similarity defined in equation (1) as the fitness of the genetic algorithm. Naturally, object detection is transformed into optimization problem. The initial orientation of a backlight unit is obtained with statistical gradient orientation histogram. Then, the pose can be acquired by the heuristic local search strategy, crossover strategy, clone strategy, and mutation strategy which are designed to speed up the searching process. The HHGA is designed for the backlight units in which there have many parallel segments to ensure that the dominant orientation can be extracted. However, the heuristic strategy will produce many offspring which are not the right candidate position if there are too many segments. So it may not work for the general linear structure objects. This paper designed a heuristic coarse-to-fine localization method based on the shape matching method. It is different with the state-of-the-art algorithms in three aspects. The first aspect is that it can be applied to most kinds of objects with linear structure objects only with the modification of the parameters. The second aspect is that the heuristic information is integrated into the localization to reduce the searching range and speed up the search process. The last aspect is that the coarse step and fine step can be used separately according to the actual applications. The details are as follows.
3. Proposed Method for Real-Time Localization of Linear Structure Objects
A coarse-to-fine detection method is proposed based on the characteristics of linear structure objects. The coarse step uses mean shift segmentation to get the regions of the gradient orientation image and group the regions with heuristic region combination. The fine step obtains the accurate pose of the object with a heuristic search based on the PSO.
3.1. Coarse Localization Based on Mean Shift Segmentation and Heuristic Region Grouping
Since the similarity defined in equation (1) requires the gradient orientation of all pixels of the image, the gradient orientation map is calculated first. Gradient orientation map stores the gradient orientation of each pixel, and its size is the same as that of the image. Then, the gradient orientation map is segmented by mean shift to get each region, and the gradient histogram of each region is calculated to get several maximum gradient orientation of each region. Finally, region grouping rules are designed according to the characteristics of linear structure objects and the coarse localization is obtained. The details are as follows.
First, compute the gradient orientation map. The diagram is shown in Figure 1. The vertical and horizontal gradients of point P are denoted as gv and gu, respectively. The gradient orientation of point P refers to the angle between vector <, >, and vertical axis. As the angle is a continuous value, the gradient direction needs to be discretized. Namely, [0, 360°) is discretized with an interval value computed according to the size of the object. The values of and can be calculated by addition and subtraction of the pixels. So a gradient orientation look-up table can be established, of which and are the indices. The gradient orientation map can be obtained quickly with the look-up table [21].

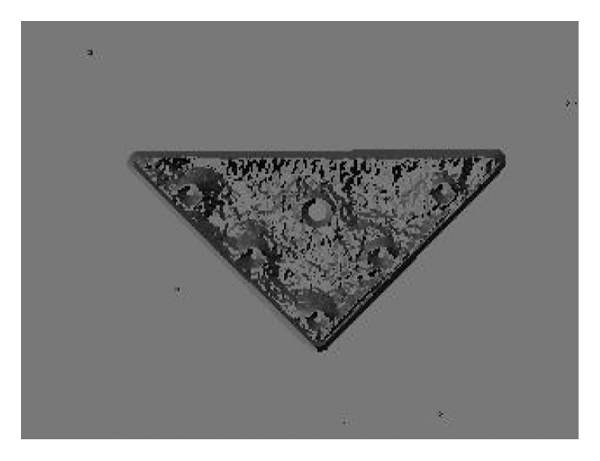
Second, get the regions use mean shift segmentation. Mean shift segmentation is an extended application of mean shift clustering. It is an efficient statistical iterative algorithm proposed by Fukunage [23]. And it is widely applied to image segmentation, object tracking, and image classification [24–26]. An image contains the linear structure object given in Figure 2(a) and the gradient orientation map is given in Figure 2(b), in which the gradient orientation value of every point is represented by gray level. The larger the gradient direction value, the lower the gray level. Figure 2(b) shows that there are linear regions at the edge of the object, and the gradient orientations of the pixels in each region have a very small difference. The detail segmentation based on mean shift includes five steps. In the first step of our solution, we set the parameters sp, sr, maxIte, and offset: sp and sr denote the iterate physical and gradient orientation radius which forms the iteration space, maxIte denotes the maximum iterative times, and offset denotes the permission error at the end of the training. Then, in the second step, we set the starting point x0 = , y0 = u0, = G (, u0), iterative space, and the number of points in it as S (x0, y0, (x0, y0)), and n, iterate time k = 1. The starting point is the first point of the region and the clustering starts from it. Then, in the third step, we compute the new iterate point according to, , . This step updates the points to find new points which have similar gradient orientation with the neighbor points. Then, in the fourth step, we judge whether the iterate should be continued: if k > maxIte or |xk − xk-1| + |yk − yk-1| + <offset, set (, u0) = , go to Step 5 if all pixels are traversed, update the iterate starting points as the unprocessed one and go to Step 2 if there are pixels not processed; else, k = k + 1, go to Step 3. Finally, in the fifth step, we use region growing to the segmented map and obtain m gradient orientations. m is set according to the number of line segments to discard the small regions.

(a)
(b)
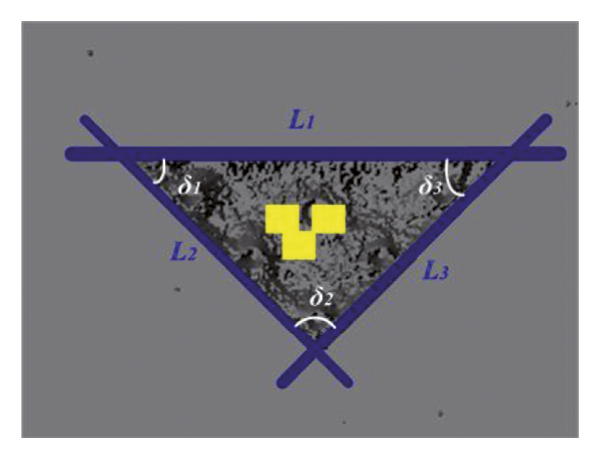
Third, speculate the coarse localization of the object. The linear regions corresponding to the line segments are split into several regions because of noises or the designed requirements, as shown in Figure 3(b). Figure 3(a) is the original image. The split regions should be grouped to speculate the coarse location. There are two rules to consider when the regions are grouped. The first rule is that the maximum gradient orientations of the regions should be the same to ensure the regions belong to the same line segment. The second rule is that the orientation of the bounding box should be very close, and the distance of the lines through the two points of the short edges of the bounding box should be smaller than a threshold. The lines of the grouped regions are fitted. As the structure is fixed, the angles between the lines can be used as the heuristic information to compute the coarse localization. As shown in Figure 3(c), L1, L2, and L3 are the fitted lines. δ1, δ2, and δ3 are the angles between L1, L2, and L3. The angles are the same as the model object. The ranges of L1, L2, and L3 can be speculated according to the regions of fitted line segments. So, the coarse location of the object is the yellow region speculated by any two lines and their included angles.

(a)

(b)
(c)
3.2. Fine Localization with Heuristic Search
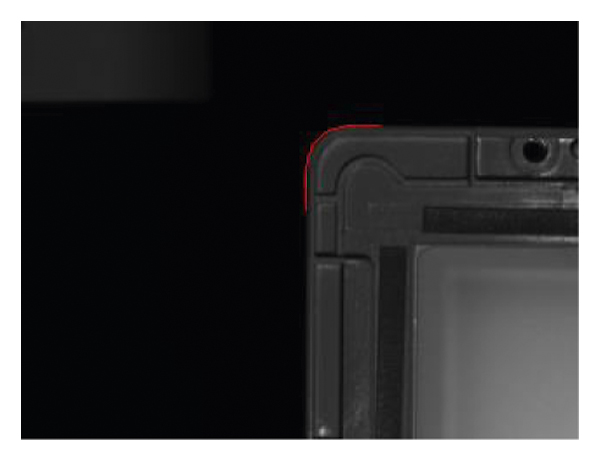
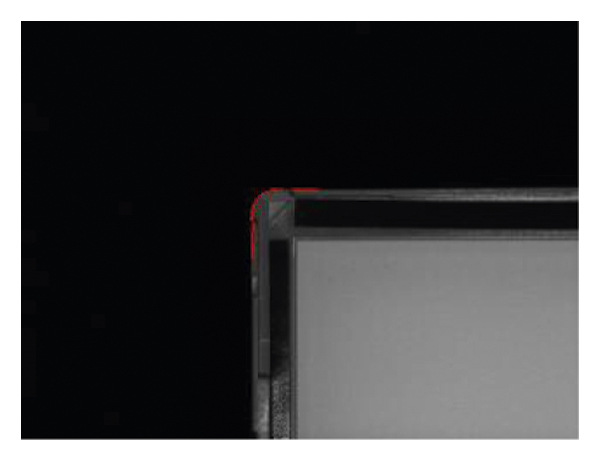
The coarse localization reduces the searching range effectively. The accurate pose is obtained with a heuristic search which incorporates the heuristic information into PSO. Heuristic information refers to the information that can speculate the pose of the object according to the linear structure. One is that the location is always on the parallel lines of the line segments. The other one is that the location is on a relative position of the intersection points of the line segments. They can be used to speculate the potential optimal location. The offset refers to the relative position between the optimal location and the intersection points of the line segments. It can be obtained from the reference image offline. Then, the optimal potential location equals to offset plus the position of the intersection points of the line segments online. As shown in Figure 4(a), Or is the location of the model object, Pr is the intersection point of line segments Lr1 and Lr2. The offset between Or and Pr can be computed offline. In Figure 4(b), After the line segments Ls1 and Ls2 and the intersection points Ps are computed, Os, which denote the potential position of the object, can be speculated by the offset and Ps.

(a)

(b)
PSO is a global optimal algorithm which is discovered through simulation of a simplified social model [19]. It belongs to swarm intelligence algorithm. The basic idea is the optimal solution can be found according to the cooperation of all particles and social sharing of information among conspeciates. It has been improved for a variety of optimization tasks, including the scheduling [27] and the machine vision [28]. This paper incorporates the heuristic information to the PSO to guide it produce new particles which are potential optimal locations. The proposed improved PSO algorithm divides the particles into two parts. The first part moves according to the inertia, the historical fitness, and the information sharing between the particle swarm and the first heuristic information. The velocity and position are updated according to equation (2) in which denotes the velocity of the ith particle, denotes the pose in which denotes the orientation expressed by the rotation angle of the model, denotes the best pose of the ith particle, is the best pose of the swarm, denotes the inertia weight, c1, c2, and c3 denote the acceleration constants, rand denotes the random value, and denotes the gradient orientation of the ith particle. The first equation in equation (2) expresses that the velocity is updated according to the best position of current particle and the optimal position of the swarm. The second equation in equation (2) expresses that the position is updated according to the velocity. The second part moves according to the second heuristic information and only the position was considered, that is, the orientation is not updated. As shown in equation (3), denotes the gradient orientation of particle , denotes the intersection point of the lines pass through two particles and with their gradient orientation as direction respectively. is the new particle which differs an offset with . It can be computed once the intersection point is obtained. The two particles can be selected when the intersection angle of the two lines satisfy the demand of the angle.
The detail of the heuristic search is as follows. In the first step, we initialize the following parameters: , c1, c2, c3, size of the swarm, and the proportion of the two parts and perform Steps 2 to 4 for all coarse locations. Then, in the second step, we initialize all particles. The information of each particle includes the position and orientation. Then, in the third step, we compute the fitness of each particle, the optimal solution of each particle, the optimal solution of all particles. The fitness refers to the similarity defined in equation (1). The accumulation should be done for every particle. Then, in the fourth step, we update particles according to equations (2) and (3), and judge the status of the new particle. It will produce a new particle randomly if all the new particles are processed. Finally, the optimal solution () of all particles are outputted. In the fourth step, the new particles depend on the information from itself and the swarm. This can ensure that the overall trend is towards the optimal location. And it can be seen from the heuristic information that the optimal location is located either around the intersection points or the line segment. Therefore, the optimal location must be found if the regions obtained from Section 3.1 are right and enough time is given.
4. Experimental Results and Discussion
To verify the effectiveness of the algorithm, two image databases about typical industrial parts and backlight units are collected. As the images contain the detail information about the products, the security of these digital images should be concerned to protect the sensitive information or avoid the disclosure of trade secrets. The security can be ensured by either confidentiality agreement [29] or visual cryptography scheme [30, 31]. The industrial parts used in Section 4.1 are public components, so the security of this image database can be ignored. The backlight units used in Section 4.2 are belongs to a television company with which we have signed a confidentiality agreement to ensure that the images can only be used to academic research. The image cipher methods will be used when the corresponding vision system are applied to the production lines. With the consideration of the running time and the size of the database, the second layer of the image pyramid is used, and the image size is 320∗240. The running time to compute the pyramid images was not included. The programming language is C++ and the running platform is i5-7200u CPU of 2.50 GHz and RAM of 8.00 GB. The running software is Visual Studio 2015, of which the release mode is used to obtain the experimental data. The proposed algorithm (MSHS) is compared with HHGA [21], shape matching method [6], and MGHT [7].
4.1. Experiment on the Image Database of Industrial Parts
There are four classes of objects in the image database of industrial parts. The objects are shown in Figure 5 with the points of the model drawn on in red color. The parameters for this database are given in Table 1. We use the evaluation indicator described by Cai et al. [21]. It can reflect the performance and time complexity of the algorithm. Specifically, it refers to the number of the wrongly detected of the online images in the limited time obtained offline.

(a)

(b)

(c)

(d)
The experimental results of the part database are shown in Table 2 in which “Fail” denotes the number of the wrongly detected images, “EI” denotes the evaluation indicator, and “Stat” denoted the statistical data of all types. In the limited time, the number of the wrongly detected images of the proposed method is the lowest which shows the high accuracy and good performance of it. There are two step of HHGA. As the first step can only detect the orientation of the objects, the searching space for the second step is still the whole image. However, MSHS can limit the searching range into a small size in the first step, and it can shorten the running time by the look-up table. Therefore, HHGA needs more time to get the right result. And the wrong number found by it is more than MSHS. The shape matching method, whose traverse time is shown in the tenth column, needs to traverse all poses of the object, so it has the highest incorrect number. As the MGHT uses voting to obtain the optimal pose, the parameter space should be discreted by small-enough intervals. The results can be judged until the voting process is completed. For the two databases, the numbers of the wrongly detected images are the same as MSHS. Therefore, only the running time is given in Tables 2 and 3 in the last column. The average running time of MSHS, ES, and MGHT is 40.25 ms, 369.250 ms, and 202.058 ms, respectively. Compared to ES and MGHT, the time saved by the proposed MSHS are 89.1% and 80.1%, respectively. For the image database of industrial parts, the experiment shows that MSHS is efficient in accuracy and performance.
4.2. Experiment on the Images Database of Backlight Units
As there are many small components on the backlight unit and the assembly lines are complicated with unstable illumination, the occlusion and low contrast should be considered in the detection. Hence, the image database of backlight units needs a higher requirement than the image database of industrial parts. The objects and the points of the model are shown in Figure 6. The parameters are given in Table 4. And the experimental results are shown in Table 3, in which, the MSHS has the lowest wrongly detected number. The average running time of MSHS, ES, and MGHT is 17 ms, 102.39 ms, and 65.05 ms, respectively. Compared to ES and MGHT, the time saved by the proposed MSHS are 83.4% and 73.9%, respectively, for this database. It is beneficial from the fast step which can reduce the searching range and the heuristic fine search.

(a)

(b)

(c)
(d)

(e)
(f)

(g)

(h)
4.3. Discussion
It can be seen from the results of the two image databases that the proposed method has the lowest wrong detection number in the limited time. With the careful analysis, it is found that the wrongly detected images always have some defects, such as the object is no longer linear with an abnormal extrusion or the linear structure is blocked. The proposed method is effective for the linear structure objects because it can give the optimal localization in shortest time, and the saved time is more than 70%. At the same time, it can be seen that the average saved time of the image database of backlight units is less than that of the image database of industrial parts. This shows that the performance of the proposed method on the image database of industrial parts is better than that on the image database of backlight units. After analysis of the two databases, we found that the proportion of the points on the line segments of the image database of industrial parts is higher than that of the image database of backlight units. The heuristic information is used in the coarse and fine localization, so it is significant to detect the linear structure objects. As the heuristic information has a close relationship with the line segments on the objects, the proposed method requires that the number of points of the line segments should satisfy a certain proportion. According to our experience, the proportion should be greater than 60% to ensure a good performance of the proposed method. The proposed method is suitable for most cases where linear structure objects are detected.
5. Conclusion
This paper proposed a real-time method to detect the linear structure objects. The method makes use of the heuristic information mined from the structure of the objects to speed up the localization process. And the heuristic information is incorporated into the coarse localization and the global optimization particle swarm optimization algorithm. The idea that the structure characteristics of the objects are combined with the image processing algorithms is helpful for the researchers to extend their algorithms to solve a certain kind of problems rather than a single specific object. Furthermore, the proposed method is evaluated on two typical objects with linear structure. And the performance has been compared with the state-of-the-art similar algorithms from different aspects. The results showed that the searching range and the detection time were reduced to ensure the real-time detection. Therefore, the proposed method can be used to the automatic production lines, where the localization of the object is needed. For future work, we plan to optimize the code of the algorithm to make it applicable for industrial application and develop new heuristic information from the objects with other structures to solve their localization or defect detection problems.
Data Availability
The image data used to support the findings of this study are available from the corresponding author upon request.
Conflicts of Interest
The authors declare that there are no conflicts of interest regarding the publication of this study.
Acknowledgments
The results of the work are obtained using the images provided by optoelectronic Information Technology Laboratory of Shenyang Institute of Automation (http://english.sia.cas.cn/). This work was financially supported by the Department of Education of Shandong Province (grant no. KJ2018BAN058).