Abstract
A large amount of data obtained by dam safety monitoring provides the basis to evaluate the dam operation state. Due to the interference caused by equipment failure and human error, it is common or even inevitable to suffer the loss of measurement data. Most of the traditional data processing methods for dam monitoring ignore the actual correlation between different measurement points, which brings difficulties to the objective diagnosis of dam safety and even leads to misdiagnosis. Therefore, it is necessary to conduct further study on how to process the missing data in dam safety monitoring. In this study, a data processing method based on partial distance combining fuzzy C-means with long short-term memory (PDS-FCM-LSTM) was proposed to deal with the data missing from dam monitoring. Based on the fuzzy clustering performed for the measurement points of the same category deployed on the dam, the membership degree of each measurement point to cluster center was described by using the fuzzy C-means clustering algorithm based on partial distance (PDS-FCM), so as to determine the clustering results and preprocess the missing data of corresponding measurement points. Then, the bidirectional long short-term memory (LSTM) network was applied to explore the pattern of changes of measurement values under identical clustering conditions, thus processing the data missing from monitoring effectively.
1. Introduction
As an indicator of the safety and work performance of concrete dam, the original measurement data always attract much attention for its integrity and accuracy [1–3]. However, due to the impact of such influencing factors, such as complicated and ever-changing operating conditions and human error, it is often difficult to prevent the actual measurement data from suffering a loss to varying extents [4]. The missing data will have an influence on the thorough assessment of dam for its serviceability, which can even lead to misjudgment in some cases. As for the traditional means to process the missing data, they include mean value processing, regression processing, expectation maximization processing, and so on [5, 6]. Nevertheless, these methods commonly suffer such problems due to the inability to reflect the correlation between samples or attributes, low processing accuracy, and limited applicability [7].
In recent years, as the study on machine learning and other emerging disciplines deepens [8–11], some new approaches for data processing have been proposed [12, 13]. By improving the k-nearest neighbors imputation method, Shichao Zhang proposed a gray processing method (GKNN) to replace the traditional Euclidean distance with gray distance [14]. Similarly, Tutz G put forward a distance-based weighted nearest neighbors imputation method [15]. However, the process for finding the adjacent samples for each incomplete sample as part of the method requires global traversal, which makes computation overly complex at the time of dealing with a huge amount of data. Chen applied LS-SVM [16] to fill the data, based on which the global optimal solution was worked out and small-scale data were made applicable. However, most of the SVM-based methods involve artificial judgment, which makes them heavily reliant on the personal experience gained by the operator. Proposed by Takagi and Sugeno, the TS nonlinear regression model [17–19] is capable of describing nonlinear problems linearly by constructing local linear models and associating these linear models with membership function. However, this model ignores the correlation between input and output, which leads to the low accuracy in processing sequence information. Through the combination between autocoding and the genetic algorithm, Abdella et al. put forward a processing method which takes the missing data as the independent variable for cost function, and the genetic algorithm was applied to optimize the cost function of the missing data to be solved [20, 21]. Based on the aforementioned method, Nelwamondo et al. introduced the dynamic programming theory to build multiple self-encoders and then selected the optimal model for each incomplete sample to process the missing data [22]. However, such methods ignore the correlation between different sample attributes, which causes the accuracy of missing data processing to be low. The newly proposed autoregressive integrated moving average model (ARIMA) hybrid method shows the advantages of both the autoregressive integrated moving average and artificial neural network, which improves its generality. Due to the need for a large data sample size, the practicability of it is not as high as that required [23].
To address the problem mentioned above, this study proposes a missing data processing method based on the partial distance fuzzy C-means (PDS-FCM) model and long short-term memory (LSTM) network. Considering the correlation between the measurement points, it relies on the membership degree of each measurement point to cluster center to carry out cluster analysis and preprocess missing data. On this basis, the bidirectional LSTM network is introduced to further process the long-sequence missing data, thus ensuring the accurate processing of missing data. The basic principle is detailed as follows.
2. Processing Method of Dam Missing Data
First, the core of the missing data processing method proposed in this study is to use PDS [24] instead of Euclidean distance strategy to represent the correlation between the measurement points of a certain type of monitoring quantity. Then, the FCM clustering algorithm is adopted to construct the membership relationship between each measurement point and the cluster center, thus achieving fuzzy clustering for the measurement points and the preprocessing of missing data. Finally, the bidirectional LSTM network is introduced to construct the training model of missing data and to process the long series missing measurement values for the measurement points under identical clustering conditions, thus achieving the effective processing of missing data.
2.1. Preprocessing Method of Missing Data
2.1.1. Characterization of Correlation between Measurement Points
When the measurement points of a certain type of monitoring quantity encounter the missing measurement value, it is difficult to measure the correlation between measurement points using those traditional distance measurement indicators. To solve this problem, this study applies PDS to characterize the correlation between different measurement points.
Suppose is an incomplete dataset with the number of measurement points and the sequence of measurement value . indicates the measurement value of the th measurement point. represents a function describing the missing data of the measurement point, which is expressed as in the following equation:where suggests that the measurement value of the th measurement point is complete at time and missing at time .
Based on equation (1), the correlation between and in the incomplete dataset can be expressed as follows:where refers to the partial distance.
2.1.2. Fuzzy Clustering of Measurement Points and Preprocessing of Measurement Values
Based on equation (2) and FCM clustering algorithm, fuzzy clustering is performed in this section for the measurement points of a certain type of monitoring quantity, and the measurement value of the measurement point is preprocessed. Similar to most clustering algorithms, the FCM algorithm splits the dataset into a number of subsets according to the similarity between samples. Each subset represents a cluster, and the center of sample distribution in the cluster is taken as the cluster center. The difference is that this method achieves the transformation of membership from 0 or 1 to [0, 1] by means of fuzzy processing. Equation (2) is applied to construct the PDS-FCM clustering model of the following equation:where represents the membership degree, which indicates the degree of the measurement point falling into the cluster, denoted as . denotes the cluster center of the cluster, and the corresponding center matrix is expressed as . is a fuzzy parameter, which indicates the degree to which these measurement points belong to each cluster.
Considering the equality constraints on membership degree in equation (3), the Lagrange multiplier method is used in this section to solve equation (3). The augmented Lagrange function applied to this process is as follows:where represents the Lagrange multiplier.
Based on equation (2) and the equality constraint of in equation (3), the necessary condition for the clustering objective function in equation (4) to reach the minimal is expressed as follows:
With the application of equations (5) and (6), the membership matrix and center matrix that meet the requirements of the accuracy of dam safety monitoring are obtained through iterative solution. The maximum membership of each measurement point to each cluster center is treated as the final clustering result.
According to the membership relationship between the missing data measurement points and the central points, the missing positions of the measurement values are preprocessed as follows:where denotes the measurement value of the th measurement point at the time after preprocessing, and indicates the measurement value of the th center at the time .
The ultimate clustering result is determined by equation (6), and the missing data are preprocessed by equation (7) based on which the data missing from dam safety monitoring can be effectively processed.
2.2. Implementation Technology of the PDS-FCM-LSTM Processing Method for the Data Missing from Dam Safety Monitoring
On the basis of the abovementioned research, the bidirectional LSTM network is introduced in this section to establish the mapping relationship between the measurement values of measurement points under identical clustering conditions, based on which the PDS-FCM-LSTM processing method is proposed.
2.2.1. Construction of Mapping Relationship between Measurement Values of the Measurement Points under Identical Clustering Conditions
The advantage of the LSTM network is that it is capable of controlling the information transfer of time series data by introducing input gate, forget gate, and output gate to the unit [9, 25–28]. It is assumed that the data of dam safety measurement point are missing from time to time , which require reprocessing. For the unit at time , the data of measurement point are defined as output variables, while the data of other measurement points in the same cluster are treated as input variables. On this basis, the mapping relationship between the measurement values of the forward LSTM network is established, as shown in Figure 1.
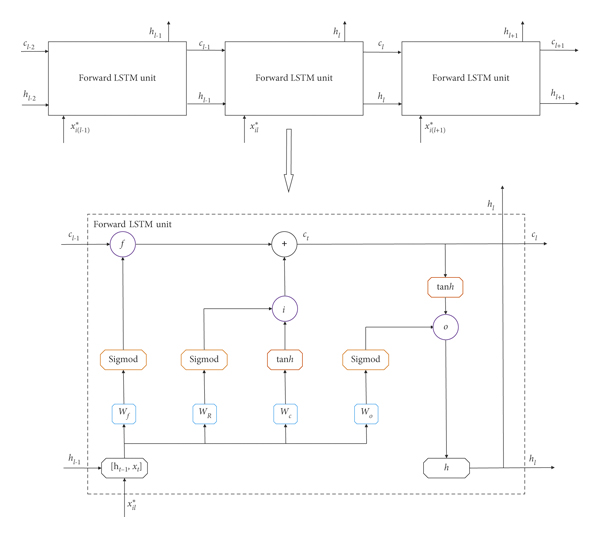
(1) Forget Gate. The output variable of the hidden layer at time and the input variable at time are taken. Equation (8) is applied to construct the output variable of the forget gate at time , which determines whether to maintain the state of the hidden unit at the previous layer.where represents the output variable after the processing by the forget gate at time , denotes the output variable of the hidden layer at time , indicates the input variable of each measurement point at time after preprocessing, refers to the bias term of the forget gate, stands for the weight matrix of the forget gate, and means the activation function of , which is expressed as follows:
(2) Input Gate. The information collected by the input gate is the same as that collected by the forget gate. Based on equations (9) and (10), the output variable of the input gate at time and the unit state at time are determined.where represents the output value after processing by the input gate at time , indicates the input gate weight matrix, denotes the unit state weight matrix, means the unit state at time , refers to the bias term of input gate, and stands for the bias term of unit state.
(3) Output Gate. The output gate is jointly determined by the updated unit state , the output variable of the hidden layer at time , and the input variable at time . The output variable of the output gate at time and the output variable of the hidden layer at time can be determined as follows:where represents the output variable processed by the output gate at time , denotes the output gate weight matrix, and indicates the bias term of the output gate.
To process the missing data of measurement value from time to time more reasonably, a new bidirectional LSTM network method is proposed to process the data from time to time . As shown in Figure 2, model training and validation are carried out on the measurement points before and after time to time , respectively, according to the aforementioned principles based on which the forward and reverse LSTM model parameters are obtained. Then, the remaining measurement point data of the complete information from time to time are input into the model. Finally, the calculation value of the measurement point with missing data corresponding to the period from time to time is obtained, so as to process the missing data bidirectionally.

2.2.2. Implementation Method of the PDS-FCM-BILSTM Processing Method for Dam Missing Data
According to the PDS-FCM-LSTM method for dam missing data processing as proposed above, the implementation process is shown in Figure 3. Step 1: input the missing dataset of the dam measurement point Step 2: enter the PDS-FCM layer to preprocess the missing data, set fuzzy parameter , cluster number , and threshold , and then randomly initialize the partition matrix Step 3: when the number of iterations is , equation (5) is used to update the prototype matrix based on the partition matrix Step 4: update the partition matrix based on equation (6) and the prototype matrix Step 5: if the conditions are met, where , the algorithm stops to output partitioning matrix and prototype matrix . Otherwise, if , return to Step 3. Step 6: based on the membership relationship between the measurement points with missing data and each cluster center , the existing values in the cluster center are weighted and averaged to obtain the preprocessed data Step 7: establish the bidirectional LSTM processing model for the missing data of the dam. The forward LSTM network model and reverse LSTM network model are constructed according to the time required to process the measurement values. Step 8: input the measurement values of each measurement point in the same cluster before and after the time slot into the forward and reverse LSTM models, so as to obtain the weight and bias of each parameter after training and learning Step 9: input the preprocessed measurement point data as sample into the forward and backward LSTM models for obtaining the forward and backward output values at time slot , with their mean values taken as the ultimate result of missing data processing

According to the above implementation steps, the implementation concept of PDS-FCM-LSTM is obtained.
2.2.3. Evaluation of the Missing Data Processing Effect
In this study, the average absolute error MAE and the average absolute percentage error MAPE are taken as the evaluation indicators of the data processing effect for the measurement points, which are defined as follows:where represents the set of all processing values, denotes the processing value, indicates the measurement value of the processing value, and corresponds to the measurement value of the measurement point with complete information.
Using equations (13) and (14) and the error allowable values listed in the technical specifications for dam safety monitoring, the effect of missing data processing is thoroughly evaluated, and the processed data meeting the accuracy requirements are taken as the effective data for dam safety monitoring.
3. Numerical Example
3.1. Project Summary
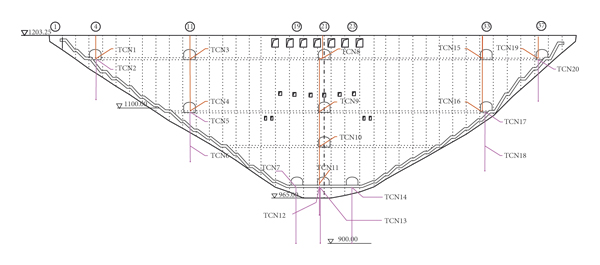
The dam is a concrete parabolic double curvature arch dam [29–32] with the height of 240 m and the crest arc length of 774.69 m. It consists of 39 dam sections from left to right. In order to monitor the horizontal displacement of arch crown, arch shoulder, and 1/4 arch ring, 8 inverted plumb lines and 10 direct plumb lines are deployed in the dam body to form 5 groups of direct and inverted plumb lines, forming a total of 20 measurement points. The plumb survey points on the left shoulder of No.4 dam section are TCN01∼TCN02, TCN03∼TCN06 on No.11 dam section, TCN07∼TCN14 on No.19 ∼23 dam section, TCN015∼TCN18 on No.33 dam section, and TCN19∼TCN20 on the right shoulder of No.37 dam section. The specific distribution of the measurement points is shown in Figure 4.
3.2. The Data Processing
Based on the time series of complete measurement data on the deformation to plumb lines from January 1, 2014, to December 31, 2019, the experiment is designed. Take TCN11 as an example, and the measurement data (31 data in total) from October 27, 2016, to March 29, 2017, are purposely deleted to construct the incomplete dataset (the data of other measurement points are complete). The missing data are shown in Figure 5.

The PDS-FCM-LSTM method proposed in this study is adopted for data processing. First, the PDS-FCM data processing model is constructed for the dam deformation measurement points. According to the measurement values obtained from the dam deformation measurement points between January 1, 2014, and December 31, 2019, the partial distance between each measurement point and the membership matrix is calculated when the minimum value is taken for the objective function . The results can be seen from Figure 6.

(a)

(b)

(c)

(d)

(e)
Then, according to the clustering principle proposed in the second section, all measurement points are clustered. The clustering results are given in Tables 1 and 2. It can be seen that the measurement points are divided into multiple clusters; TCN11 belongs to the second cluster, and TCN04, 05, and 16 are also one of them. According to equation (7), the preprocessing result of the measurement point TCN11 is shown in Figure 7.

Based on the above processing results, the data of measurement points TCN04, 05, 11, and 16 can be taken as the basic data to be used for secondary processing.
Finally, based on the integrity of the measured values before October 27, 2016, and after March 29, 2017, after preprocessing, the bidirectional LSTM network is used to process the long-sequence missing data of the measurement point TCN11. To validate the missing data processing method proposed in this study, the data missing from measurement point TCN11 between October 27, 2016, and March 29, 2017, are exemplified. It is processed by using the PDS-FCM-LSTM processing method, the LSTM network of single measurement point, and PDS-FCM processing method, respectively. The results are shown in Figure 8 and Tables 3 and 4.

It can be seen from Figure 8 and Tables 3 and 4 that the PDS-FCM-LSTM processing method proposed in this study achieves the highest processing accuracy because it gives full consideration to the correlation between measurement points and the pattern of changes in measurement values. PDS-FCM takes into account only the correlation between the measurement points, which makes the outcome of treatment less satisfactory. The single-point LSTM performs the worst in terms of the processing effect because it considers only the pattern of changes in measurement values while ignoring the correlation between the measurement points. In addition, it can be seen from Table 3 that the absolute errors of the outcome of PDS-FCM-LSTM treatment proposed in this study are all less significant than that specified for the water project (29), which demonstrates the effectiveness of the missing data processing method proposed in this study.
4. Conclusion
(1)To solve the problem that the traditional distance measurement indicators are ineffective in measuring the correlation between the measurement points when the dam suffers incomplete monitoring information, the method for characterizing the correlation between survey points is studied and proposed on the basis of partial distance. Then, the construction technology of the PDS-FCM clustering model is studied, which achieves the preprocessing of data missing from dam safety monitoring and lays a foundation for the effective processing of missing data.(2)Considering the correlation and trend of the changes in effect size for monitoring, a PDS-FCM-LSTM processing method intended for the data missing from dam safety monitoring is proposed. It combines the advantages of PDS-FCM and LSTM. The effectiveness of the proposed method is verified in practical engineering application. As the proposed method is universally applicable, it is suited for missing data processing in similar projects.Data Availability
The data used to support the findings of this study are from a large water conservancy project and not suitable to upload to the network. The data are included within the Supplementary Information files.
Conflicts of Interest
The authors declare that there are no conflicts of interest.
Acknowledgments
This work was supported by the National Natural Science Foundation of China (51779086, 52079046, and 51609074) and the Fundamental Research Funds for the Central Universities (B210202017).
Supplementary Materials
Experimental data.pdf provides all measured values of all measuring points of a concrete dam from January 2, 2014, to December 31, 2019. It should be noted that TCN1-20 refers to measuring points 1–20 and the green box represents the data deleted purposely. . (Supplementary Materials)